
- Title
-
Cross-Scale Integrin Regulation Organizes ECM and Tissue Topology
- Authors
- Jülich, D., Cobb, G., Melo, A.M., McMillen, P., Lawton, A.K., Mochrie, S.G., Rhoades, E., Holley, S.A.
- Source
- Full text @ Dev. Cell
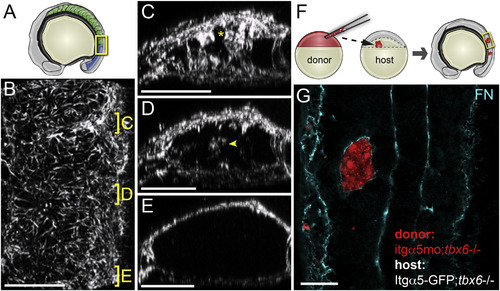
Regulation of FN Matrix Fibrillogenesis within the Paraxial Mesoderm (A) A schematic showing the somites (green) and mesenchymal PSM (blue). The yellow box indicates the regions shown in (B)–(E). (A) A dorsal view of the tissue with anterior at the top. The positions of the sections of the mature (C) and nascent (D) borders and PSM (E) are indicated. The asterisk in (C) indicates the somite border matrix contiguous with the dorsal surface of the tissue. The arrowhead in (D) indicates de novo matrix assembly within the nascent boundary. For the FN IHC analysis, z-stacks were acquired and analyzed for 13 embryos from three independent stainings. In (C)–(E), the dorsal is up. (B–E) A 3D reconstruction of the FN matrix in the paraxial mesoderm (see Movie S1). (F) A schematic of cell transplantation from a labeled donor blastula into host blastula. The tbx6-/- background is used since they make no somite boundaries. The embryos develop until the 8–16 somite stage and clones are examined for FN matrix. (G) Isolated paraxial mesoderm clones lacking itgα5, due to itgα5 morpholino injection, are coated with FN by Itgα5 expressed on adjacent host paraxial mesoderm cells. The scale bars represent 40 µm. |
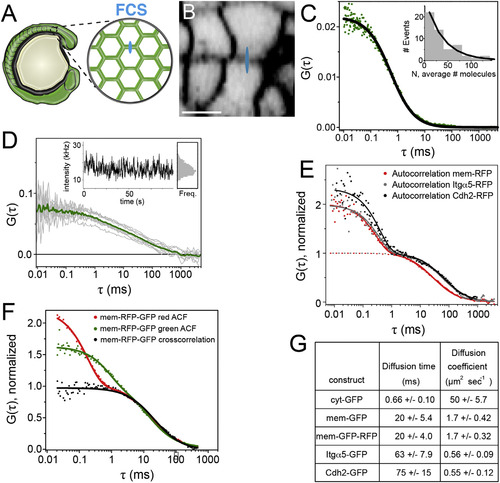
Quantification of Itgα5 Dynamics in the Presomitic Mesoderm (A) A schematic of FCS data collection for fluorescently tagged proteins in the PSM. For FCS, the confocal volume (drawn approximately to scale in blue in A and B) was statically positioned in a cell membrane oriented orthogonally to the optical axis. (B) Confocal image of a zebrafish embryo expressing membrane RFP (mem-RFP). The scale bar represents 10 µm. (C) Autocorrelation curve of cytosolic GFP (cyt-GFP), fit to 3D diffusion (Equation 1 in the Supplemental Information). The inset shows a histogram of the measured number of Itgα5-GFP molecules. (D) Representative set of ten autocorrelation curves (gray) of Itgα5-GFP with the averaged curve used in fitting (green). The inset shows the intensity fluctuations and binned intensities from this measurement. (E) Autocorrelation measurements of mem-RFP, Itgα5-RFP, and Cdh2-RFP. The fits to 2D diffusion and fluorophore fluctuation (solid line, Equation 3 in the Supplemental Information) and to 2D diffusion only (dotted line, Equation 2 in the Supplemental Information). To facilitate the comparison, the diffusion components are normalized to one. (F) Autocorrelation curves of mem-GFP-RFP illustrating the fast decay component is fluorophore specific, but the slow decay, i.e., diffusion, is identical in both autocorrelation curves, as well as the cross-correlation curve. (G) Table of measured diffusion times and calculated diffusion coefficients ± SD. |
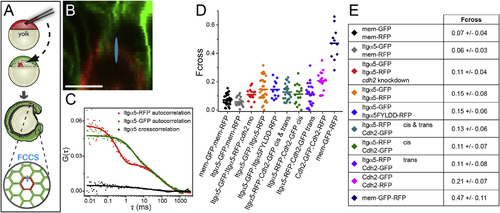
Quantification of Protein Association in the Presomitic Mesoderm (A) A schematic of cell transplantation and FCCS data collection. For FCCS, the confocal volume (drawn approximately to scale in blue in A and B) was positioned at a membrane interface between RFP and GFP expressing cells. (B) Confocal image of a mosaic embryo comprised of cells expressing mem-RFP and mem-GFP. The scale bar represents 10 µm. (C) Autocorrelation and cross-correlation measurements of Itgα5-RFP and Itgα5-GFP in a mosaic interface show low cross-correlation. (D) Plots of cross-correlation from individual measurements and mean values. (E) Table of cross-correlation (Fcross) magnitude ± SD. The significance was examined using both t test (two tailed, unequal variance) and Mann-Whitney U. There were no statistically significant differences in mem-GFP/mem-RFP compared to Itgα5-GFP/mem-RFP and Itgα5-GFP/Itgα5-RFP compared to Itgα5-GFP/Itgα5FYLDD-RFP. Notably, either mem-GFP/mem-RFP or Itgα5-GFP/mem-RFP compared to either Itgα5-GFP/Itgα5-RFP or Itgα5-GFP/Itgα5FYLDD-RFP differed (p < 0.002). The Itgα5-RFP/Cdh2-GFP trans Fcross differs from the negative control (p < 0.05), but not from the Itgα5-RFP/Cdh2-GFP cis Fcross. The Itgα5-GFP/Itgα5-RFP Fcross in the absence of Cdh2 is significantly lower (p < 0.05) than the Itgα5-GFP/Itgα5-RFP Fcross in the presence of Cdh2. See Figure S1 for apparent KD calculations. |
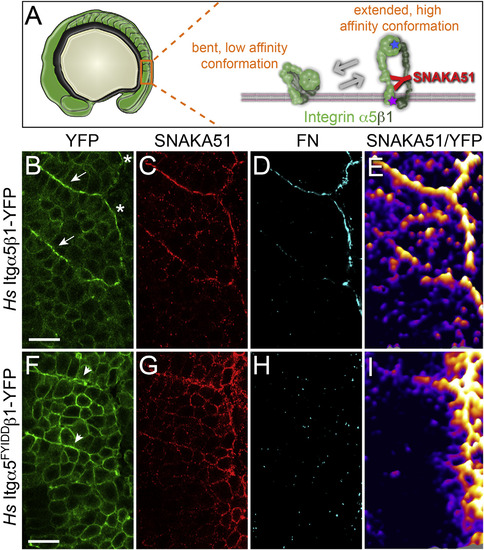
Itgα5 Adopts the Active, Extended Conformation Independently of Ligand Binding (A) A schematic of the bent and extended Itgα5β1. The SNAKA51 antibody recognizes an epitope on the extracellular domain of Itgα5 that is exposed when the Itgα5β1 adopts the extended, active conformation (see also Figure S2). The blue star represents the five amino acid substitutions in Itgα5FYIDD that eliminate ligand binding. The magenta star represents the two amino acid substitutions in Itgα5GAAKR that promote adoption of the extending active conformation. (B–E) Confocal images of MZ itgα5-/- mutant embryos expressing Hs Itgα5β1-YFP (B) immunostained with the conformation-specific anti-Hs Itgα5 antibody SNAKA51 (C) and anti-FN antisera (D). The arrows in (B) indicate somite borders and the asterisks denote the lateral surface of the tissue. There were six experiments that were performed with n = 55 embryos analyzed. (E) To normalize the SNAKA51 signal to the level of YFP, a ratiometric topological heat map was generated. The warmer colors indicate higher relative levels of extended, active Itgα5β1. The same pattern of Itg±5 activation is observed in the absence of BiFC when using Hs Itgα5-GFP for ratio imaging (data not shown). (F–I) Shows confocal images of a parallel analysis of MZ itgα5-/- mutant embryos expressing Hs Itgα5FYIDD ligand binding deficient Integrin. The arrowheads in (F) indicate ephemeral Itgα5FYIDDβ1 clustering. There were six experiments that were performed with n = 52 embryos analyzed. In (B)–(I), anterior is up and lateral is right. The scale bars represent 20 µm. |
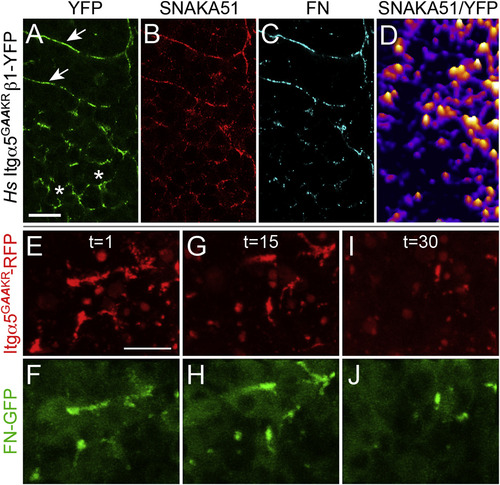
Itgα5 Conformation Regulates Itgα5 Clustering and FN Matrix Assembly in the Presomitic Mesoderm Itgα5GAAKR contains two amino acid substitutions that bias toward the extended, active conformation. (A–D) Hs Itgα5GAAKRβ1-YFP (A) clusters along somite boundaries (arrows) in MZ itgα5-/- embryos, but also inappropriately clusters in the PSM (asterisks). This inappropriate clustering colocalizes with Hs Itgα5GAAKRβ1-YFP adoption of the active conformation (B and D) and FN aggregation (C). SNAKA51 and FN IHC were examined in 51 Hs Itgα5GAAKRβ1-YFP expressing MZ itgα5-/- embryos (five experiments). (E–J) Hs Itgα5GAAKRβ1-RFP clustering and FN-GFP aggregation in the PSM is unstable. The time-lapses of three Tg(tbx6l:fn1a-GFP) embryos coinjected with the itgα5 morpholino and itgα5GAAKR-RFP mRNA were acquired and analyzed. The three time points t = 1 (E and F), t = 15 (G and H), and t = 30 (I and J) show the correlated changes in Itgα5GAAKR-RFP clustering and FN-GFP aggregation in the anterior PSM. The scale bars represent 20 µm. The images are from a 94 min time-lapse, with a z stack spanning 14 µm acquired every 4 min (see Movie S2). |
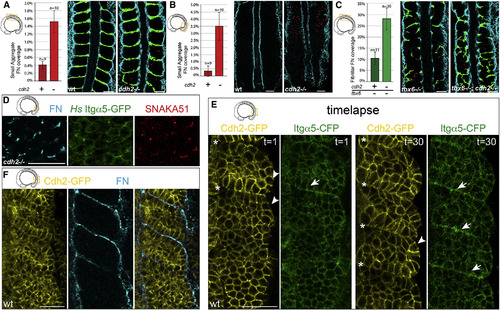
Cdh2 Represses Itgα5 Activation (A and B) cdh2-/- embryos produce significantly more ectopic small aggregates of FN matrix (red) in the mesenchyme of both (A) the anterior (p < 0.005 and t test) and (B) the posterior paraxial mesoderm (p < 0.02 and t test). (C) tbx6-/-;cdh2-/- embryos produce significantly more FN fibrils (green) in the anterior paraxial mesoderm mesenchyme than tbx6-/- controls (p < 0.01 and t test). The mean values ± SEM are shown. (D) Ectopic FN assembly, Itgα5 clustering, and adoption of the active Itgα5 conformation are observed in the PSM mesenchyme of cdh2 mutants (n = 38 embryos). (E) The first and last time points of a 90 min time-lapse (one frame every 3 min) of Cdh2-GFP and Itgα5-CFP localization during somite morphogenesis (see also Movie S3). The Cdh2-GFP levels decrease at somite boundaries (asterisks), while Itgα5-CFP levels increase (arrows) due to clustering. The Cdh2-GFP is also diminished along the surface of the paraxial mesoderm (arrowheads) (n = 4 time-lapses). (F) Cdh2-GFP levels anti-correlate with site of FN assembly along somite boundaries and the tissue surface (n = 8 embryos). The scale bars represent 40 µm. |
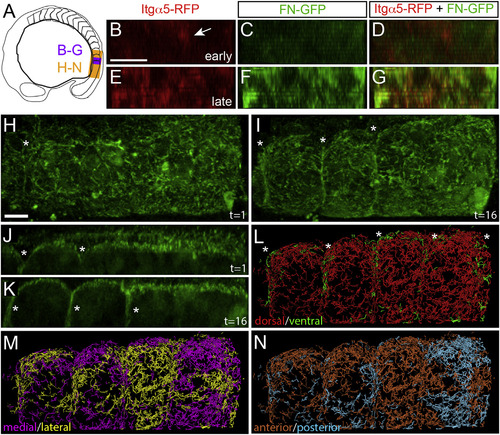
FN Matrix Fibrillogenesis and Remodeling at the Somite Boundary (A) A schematic indicating the regions shown in subsequent figure panels. (B–G) Shows digital transverse sections of a 93 min time-lapse of a nascent somite border in an Itgα5-RFP; Tg(tbx6l:fn1a-GFP) embryo with 11 µm z stacks of 1 µm intervals acquired every 3 min. Early: time-point five (12 min into the movie) and late: time-point 31 (90 min into the movie). The arrow in (B) indicates Itgα5-RFP clustering prior to the appearance of detectable levels of FN matrix. See also Movie S4. There were 11 time-lapses of itgα5-RFP;Tg(tbx6l:fn1a-GFP) embryos that were acquired and analyzed. (H–N) We acquired seven time-lapses of Tg(tbx6l:fn1a-GFP) embryos. Shown are the images from a 3D reconstruction of a 195 min time-lapse with 40 µm z stacks taken every 6.5 min. (H and J) Time point one is shown. (I and K) Time point 16, 97 min into the movie. The asterisks indicate the somite boundaries. (J) and (K) Show parasagittal sections, while all others (H–N) are dorsal views. The anterior is left in (H)–(N). See also Movie S5. (L–N) Motion of the FN matrix was examined using particle tracking. Individual tracks were color coded to indicate whether they exhibited a net displacement along the dorsal-ventral axis (L), medial-lateral axis (M), or anterior-posterior axis (N). The ventral motion displays a segmental pattern corresponding to the somite boundaries (asterisks). The scale bars represent 40 µm. |
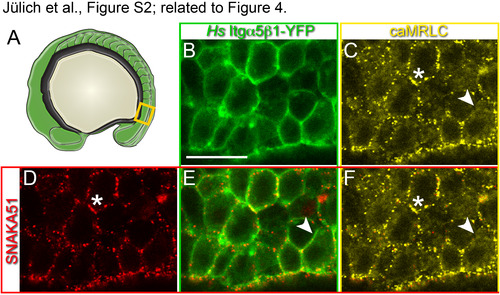
In vivo visualization of the extended, active conformation of Itgα5β1. FN matrix fibrillogenesis and Itgα5β1-FN binding is stimulated by cytoskeletal contractility (Friedland et al., 2009; Schwarzbauer and DeSimone, 2011). To validate the specificity of the SNAKA51 antibody for the activated Itgα5 conformation within the zebrafish presomitic mesoderm, we confirmed that increasing actomyosin contractility elevated SNAKA51 binding. We genetically increased actomyosin contractility by mosaically expressing an RFP-tagged activated myosin regulatory light chain 2 (caMRLC2) in MZ itgα5-/- embryos also expressing Hs Itgα5β1-YFP (Iwasaki et al., 2001; Norden et al., 2009).(A) Itgα 5 conformation was assayed in the mesenchymal presomitic mesoderm (orange box). (B) Expression of Hs Itgα5β1-YFP (green) outlines the cell cortices in the presomitic mesoderm. Scale bar is 20 µm. (C) Mosaic expression of caMRLC-RFP (yellow). (D) SNAKA51 immunolocalization (red). (E) SNAKA51 localizes with some but not all Hs Itgα5β1-YFP. (F) Puncta of caMRLC colocalize with SNAKA51 (asterisks). Arrowheads indicate inactive Itgα5β1 lacking colocalized caMRLC. In 4 experiments, 58% of 33 embryos exhibited the correlation between caMRLC expression and increased SNAKA51 signal. Thus, caMRLC2 increased SNAKA51 signal relative to adjacent control cells which is consistent with SNAKA51 recognizing the extended active form of Itgα5 in the zebrafish embryo. |

Activated Itgα5 induces FN matrix production and actin colocalization but does not affect β-Catenin localization. Localization of Itgα5GAAKR-GFP (green) and β-Catenin (magenta) at low (A) and high (B) resolution. Expression of Itgα5GAAKRGFP in MZ itgα5-/- embryos does not cause loss of adhesions associated with Integrin clustering (n=19 embryos). Localization of Itgα5GAAKR-GFP (green) and f-actin via phalloidin staining (red) at low (C) and high (D) resolution. As Integrin clustering normally colocalizes with thick cortical f-actin along somite borders (Jülich et al., 2005; Jülich et al., 2009), activated Itgα5GAAKR-GFP clustering colocalizes with higher levels of f-actin (n=16 embryos).(E) Itgα5GAAKR-GFP mRNA was injected into MZ itgα5-/- embryos and late blastula cells were transplanted into late blastula wild-type embryos. Clones were analyzed in the paraxial mesoderm of 10-13 somite stage embryos (n=85 embryos). Of 51 clones in the PSM, 37% showed FN along the surface of the clone, while 53% of clones in the somitic mesoderm exhibited FN on the surface of the clone. Scale bars are 20 µm. FAK phosphorylation follows Itgα5 clustering and ligand binding. Focal Adhesion Kinase (FAK) mediates Integrin outside-in signaling in response to FN binding and is necessary for normal FN fibrillogenesis (Ilic et al., 2004). In addition, expression of a dominant negative FAK perturbs Xenopus somite morphogenesis (Kragtorp and Miller, 2006). in vitro, phosphorylation of FAK on Y397 [pFAK(Y397)] is indicative of full FAK activation via cell anchoring and application of mechanical tension (Friedland et al., 2009). pFAK(Y397) is observed along zebrafish somite boundaries and is significantly reduced in itgα5-/- embryos (Crawford et al., 2003; Henry et al., 2001; Koshida et al., 2005). Using immunolocalization for pFAK(Y397), we sought to determine the timing of FAK activation relative to Itgα5 clustering and ligand binding during border morphogenesis. (F and G) We performed immunohistochemistry for pFAK(Y397) on fixed MZ itgα5-/- embryos rescued with Itgα5-GFP. Higher pFAK(Y397) phosphorylation can be observed along the somite boundaries relative to the basal level of pFAK(Y397) present with the presomitic mesoderm. We compared the pFAK(Y397) pattern with that of Itgα5-GFP on nascent somite borders and observed some Itgα5-GFP clustering that did not colocalize with pFAK(Y397). The arrowhead indicates a region of Itgα5 clustering that precedes the increase in pFAK(Y397) while the arrow designates a more mature somite border. These data suggest both that clustering precedes the onset of FAK phosphorylation and that FAK is phosphorylated only after Itgα5 adopts the extended conformation and binds FN. To examine this hypothesis, we performed immunohistochemistry for pFAK(Y397) on MZ itgα5-/- embryos expressing the ligand binding deficient Itgα5FYLDD-GFP. (H and I) confocal images of MZ itgα5-/- embryos expressing Hs Itgα5FYIDDβ1-YFP. Arrows indicate transient segmental Integrin clustering. No elevated levels of pFAK(397) are associated with Hs Itgα5FYIDDβ1 clustering. While Itgα5FYLDD-GFP transiently clusters in a segmental pattern, we observed no colocalization of elevated pFAK(Y397) above background. These data suggest that Itgα5 first clusters and adopts the extended “active” conformation, then binds FN, and then initiates outside-in signaling via FAK phosphorylation. The in vitro requirement for FAK in FN fibrillogenesis (Ilic et al., 2004) suggests that FAK phosphorylation induces a positive feedback that is necessary for FN matrix remodeling. (J and K) confocal images of MZ itgα5-/- embryos expressing activated Hs Itgα5GAAKRβ1-YFP. Arrows indicate Integrin clustering at somite borders. No elevated levels of pFAK(397) are associated with inappropriate Itgα5GAAKRβ1 clustering in the anterior presomitic mesoderm (asterisk). This lack of FAK activation, and hence failure to establish the positive feedback, correlates with the ephemeral dynamics of the associated FN matrix (Figure 5). In all panels, anterior is up and lateral is right. We examined pFAK in 104 embryos expressing wild-type itgα5 (7 experiments), 64 embryos expressing ligand binding-deficient itgα5 (6 experiments) and 57 embryos expressing activated itgα5 (5 experiments). Scale bars are 20 µm. |
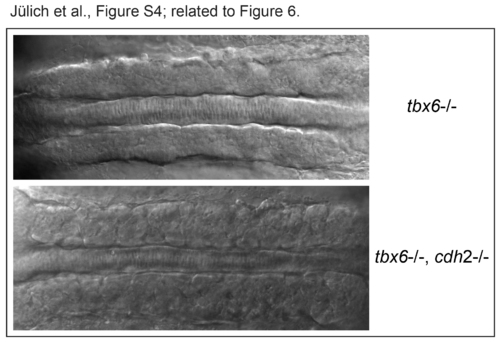
Dorsal DIC images of tbx6-/- and tbx6-/-; cdh2-/- embryos. tbx6-/- ;cdh2-/- embryos contain more incomplete and irregular boundaries within the somitic mesoderm compared to tbx6-/- embryos. This difference correlates with the increase in FN fibrils in tbx6-/-; cdh2-/- embryos. |
Reprinted from Developmental Cell, 34(1), Jülich, D., Cobb, G., Melo, A.M., McMillen, P., Lawton, A.K., Mochrie, S.G., Rhoades, E., Holley, S.A., Cross-Scale Integrin Regulation Organizes ECM and Tissue Topology, 33-44, Copyright (2015) with permission from Elsevier. Full text @ Dev. Cell