
Fig. 3
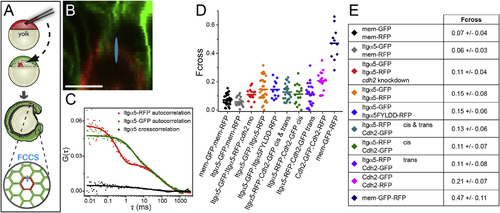
Quantification of Protein Association in the Presomitic Mesoderm (A) A schematic of cell transplantation and FCCS data collection. For FCCS, the confocal volume (drawn approximately to scale in blue in A and B) was positioned at a membrane interface between RFP and GFP expressing cells. (B) Confocal image of a mosaic embryo comprised of cells expressing mem-RFP and mem-GFP. The scale bar represents 10 µm. (C) Autocorrelation and cross-correlation measurements of Itgα5-RFP and Itgα5-GFP in a mosaic interface show low cross-correlation. (D) Plots of cross-correlation from individual measurements and mean values. (E) Table of cross-correlation (Fcross) magnitude ± SD. The significance was examined using both t test (two tailed, unequal variance) and Mann-Whitney U. There were no statistically significant differences in mem-GFP/mem-RFP compared to Itgα5-GFP/mem-RFP and Itgα5-GFP/Itgα5-RFP compared to Itgα5-GFP/Itgα5FYLDD-RFP. Notably, either mem-GFP/mem-RFP or Itgα5-GFP/mem-RFP compared to either Itgα5-GFP/Itgα5-RFP or Itgα5-GFP/Itgα5FYLDD-RFP differed (p < 0.002). The Itgα5-RFP/Cdh2-GFP trans Fcross differs from the negative control (p < 0.05), but not from the Itgα5-RFP/Cdh2-GFP cis Fcross. The Itgα5-GFP/Itgα5-RFP Fcross in the absence of Cdh2 is significantly lower (p < 0.05) than the Itgα5-GFP/Itgα5-RFP Fcross in the presence of Cdh2. See Figure S1 for apparent KD calculations. |
Reprinted from Developmental Cell, 34(1), Jülich, D., Cobb, G., Melo, A.M., McMillen, P., Lawton, A.K., Mochrie, S.G., Rhoades, E., Holley, S.A., Cross-Scale Integrin Regulation Organizes ECM and Tissue Topology, 33-44, Copyright (2015) with permission from Elsevier. Full text @ Dev. Cell