
|
Fig. 3
Quantification of Protein Association in the Presomitic Mesoderm
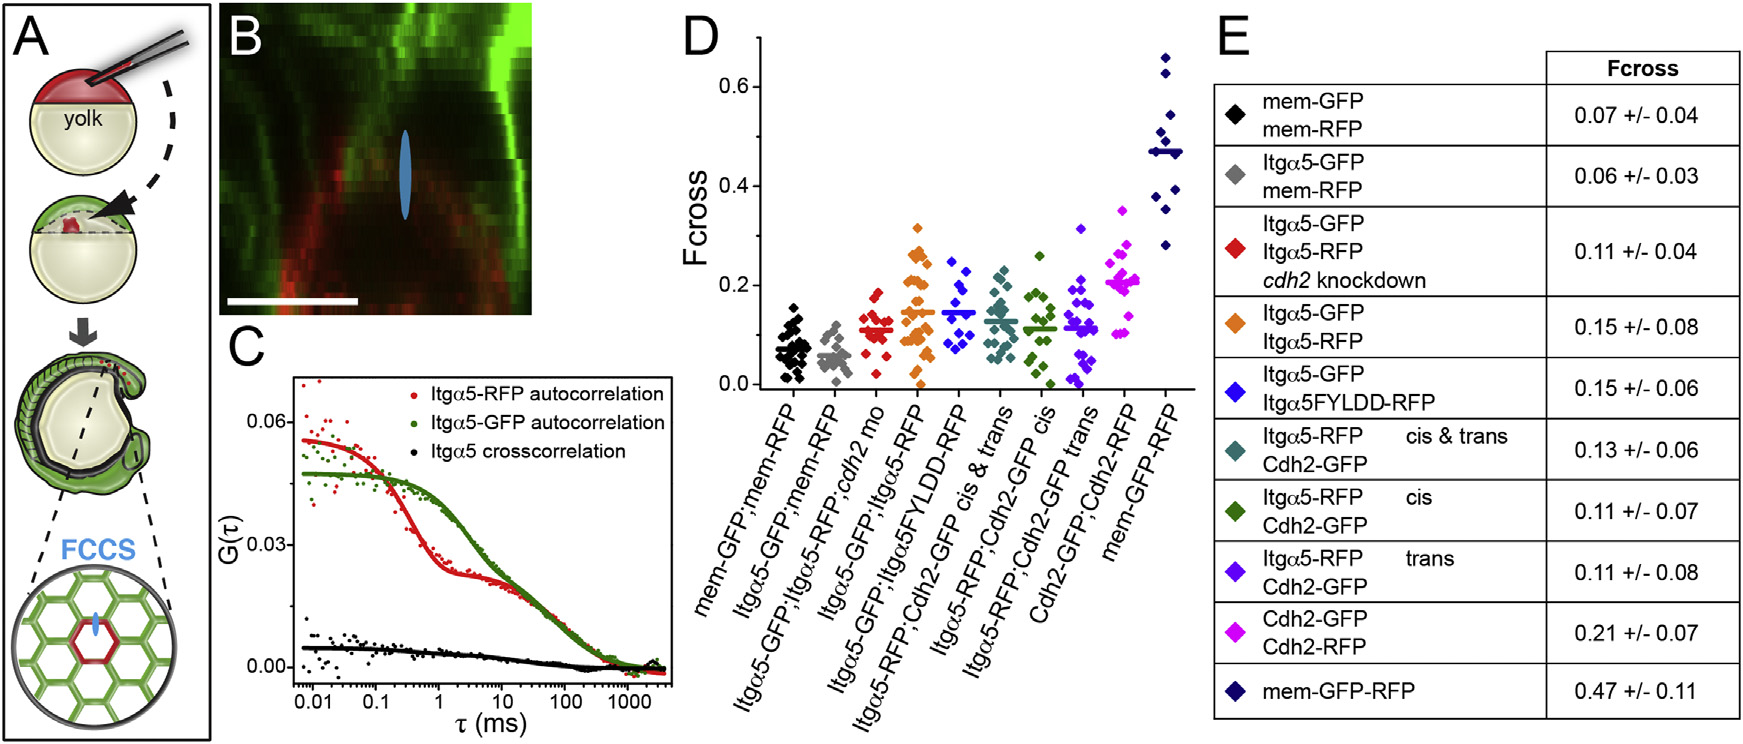
(A) A schematic of cell transplantation and FCCS data collection. For FCCS, the confocal volume (drawn approximately to scale in blue in A and B) was positioned at a membrane interface between RFP and GFP expressing cells.
(B) Confocal image of a mosaic embryo comprised of cells expressing mem-RFP and mem-GFP. The scale bar represents 10 µm.
(C) Autocorrelation and cross-correlation measurements of Itgα5-RFP and Itgα5-GFP in a mosaic interface show low cross-correlation.
(D) Plots of cross-correlation from individual measurements and mean values.
(E) Table of cross-correlation (Fcross) magnitude ± SD. The significance was examined using both t test (two tailed, unequal variance) and Mann-Whitney U. There were no statistically significant differences in mem-GFP/mem-RFP compared to Itgα5-GFP/mem-RFP and Itgα5-GFP/Itgα5-RFP compared to Itgα5-GFP/Itgα5FYLDD-RFP. Notably, either mem-GFP/mem-RFP or Itgα5-GFP/mem-RFP compared to either Itgα5-GFP/Itgα5-RFP or Itgα5-GFP/Itgα5FYLDD-RFP differed (p < 0.002). The Itgα5-RFP/Cdh2-GFP trans Fcross differs from the negative control (p < 0.05), but not from the Itgα5-RFP/Cdh2-GFP cis Fcross. The Itgα5-GFP/Itgα5-RFP Fcross in the absence of Cdh2 is significantly lower (p < 0.05) than the Itgα5-GFP/Itgα5-RFP Fcross in the presence of Cdh2. See Figure S1 for apparent KD calculations.
Reprinted from Developmental Cell, 34(1), Jülich, D., Cobb, G., Melo, A.M., McMillen, P., Lawton, A.K., Mochrie, S.G., Rhoades, E., Holley, S.A., Cross-Scale Integrin Regulation Organizes ECM and Tissue Topology, 33-44, Copyright (2015) with permission from Elsevier. Full text @ Dev. Cell