
Fig. 1
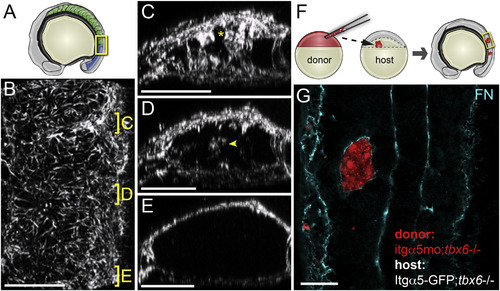
Regulation of FN Matrix Fibrillogenesis within the Paraxial Mesoderm (A) A schematic showing the somites (green) and mesenchymal PSM (blue). The yellow box indicates the regions shown in (B)–(E). (A) A dorsal view of the tissue with anterior at the top. The positions of the sections of the mature (C) and nascent (D) borders and PSM (E) are indicated. The asterisk in (C) indicates the somite border matrix contiguous with the dorsal surface of the tissue. The arrowhead in (D) indicates de novo matrix assembly within the nascent boundary. For the FN IHC analysis, z-stacks were acquired and analyzed for 13 embryos from three independent stainings. In (C)–(E), the dorsal is up. (B–E) A 3D reconstruction of the FN matrix in the paraxial mesoderm (see Movie S1). (F) A schematic of cell transplantation from a labeled donor blastula into host blastula. The tbx6-/- background is used since they make no somite boundaries. The embryos develop until the 8–16 somite stage and clones are examined for FN matrix. (G) Isolated paraxial mesoderm clones lacking itgα5, due to itgα5 morpholino injection, are coated with FN by Itgα5 expressed on adjacent host paraxial mesoderm cells. The scale bars represent 40 µm. |
Reprinted from Developmental Cell, 34(1), Jülich, D., Cobb, G., Melo, A.M., McMillen, P., Lawton, A.K., Mochrie, S.G., Rhoades, E., Holley, S.A., Cross-Scale Integrin Regulation Organizes ECM and Tissue Topology, 33-44, Copyright (2015) with permission from Elsevier. Full text @ Dev. Cell