
Fig. 7
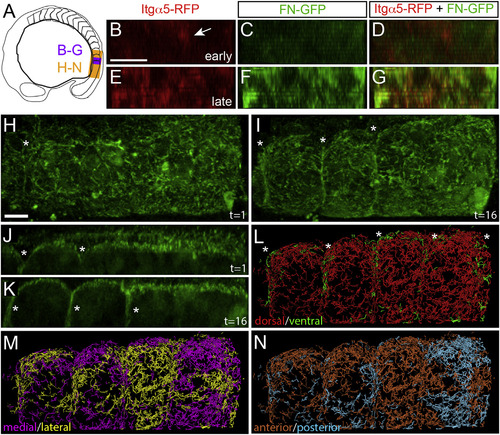
FN Matrix Fibrillogenesis and Remodeling at the Somite Boundary (A) A schematic indicating the regions shown in subsequent figure panels. (B–G) Shows digital transverse sections of a 93 min time-lapse of a nascent somite border in an Itgα5-RFP; Tg(tbx6l:fn1a-GFP) embryo with 11 µm z stacks of 1 µm intervals acquired every 3 min. Early: time-point five (12 min into the movie) and late: time-point 31 (90 min into the movie). The arrow in (B) indicates Itgα5-RFP clustering prior to the appearance of detectable levels of FN matrix. See also Movie S4. There were 11 time-lapses of itgα5-RFP;Tg(tbx6l:fn1a-GFP) embryos that were acquired and analyzed. (H–N) We acquired seven time-lapses of Tg(tbx6l:fn1a-GFP) embryos. Shown are the images from a 3D reconstruction of a 195 min time-lapse with 40 µm z stacks taken every 6.5 min. (H and J) Time point one is shown. (I and K) Time point 16, 97 min into the movie. The asterisks indicate the somite boundaries. (J) and (K) Show parasagittal sections, while all others (H–N) are dorsal views. The anterior is left in (H)–(N). See also Movie S5. (L–N) Motion of the FN matrix was examined using particle tracking. Individual tracks were color coded to indicate whether they exhibited a net displacement along the dorsal-ventral axis (L), medial-lateral axis (M), or anterior-posterior axis (N). The ventral motion displays a segmental pattern corresponding to the somite boundaries (asterisks). The scale bars represent 40 µm. |
Reprinted from Developmental Cell, 34(1), Jülich, D., Cobb, G., Melo, A.M., McMillen, P., Lawton, A.K., Mochrie, S.G., Rhoades, E., Holley, S.A., Cross-Scale Integrin Regulation Organizes ECM and Tissue Topology, 33-44, Copyright (2015) with permission from Elsevier. Full text @ Dev. Cell