
- Title
-
Differential expression of protocadherin-19, protocadherin-17, and cadherin-6 in adult zebrafish brain
- Authors
- Liu, Q., Bhattarai, S., Wang, N., Sochacka-Marlowe, A.
- Source
- Full text @ J. Comp. Neurol.
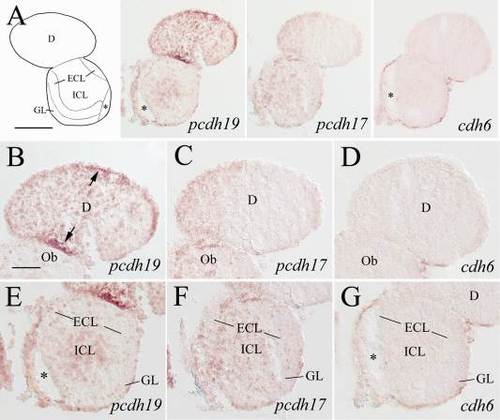
Expression of pcdh19, pcdh17, and cdh6 in the telencephalon (anterior region) and olfactory bulb. In the top panels, a schematic drawing of half of the brain section (left or right side) processed for pcdh19 staining is used to indicate major brain structures at this level, which is accompanied by low magnifications of half of the brain sections (left or right side, from adjacent areas). The anterior–posterior level of the brain region is shown in Fig. 1. The top panels of most of the subsequent figures with low magnified views of brain sections are similarly arranged. B–D: Higher magnifications of their respective dorsal telencephalon in the upper panels, while E–G are higher magnified views of the olfactory bulb in the upper panels. The arrows in panel B indicate cells with stronger staining. Asterisks indicate artificial cracks in the tissue sections. See list for abbreviations. Scale bar = 200 µm for the top panels, 50 µm for the lower panels (B–G have the same magnification). EXPRESSION / LABELING:
|
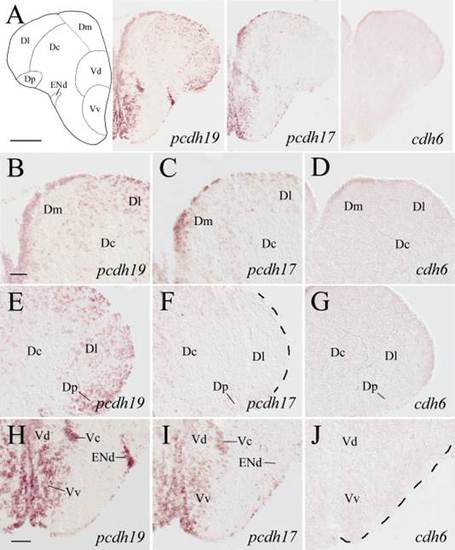
Expression of pcdh19, pcdh17, and cdh6 in the precommissural telencephalon. Images in the top panels show low magnified views of adjacent brain regions at a level shown in Fig. 1. B–D: Higher magnifications of the dorsomedial regions of the dorsal telencephalon, while E–G show higher magnified views of the dorsolateral regions of the dorsal telencephalon shown in the top respective panels. H–J: Higher magnifications of the ventral regions of the telencephalon shown in the top panels. See list for abbreviations. Scale bar = 200 µm for the top panels, 50 µm for the lower panels (B–G have the same magnification). EXPRESSION / LABELING:
|
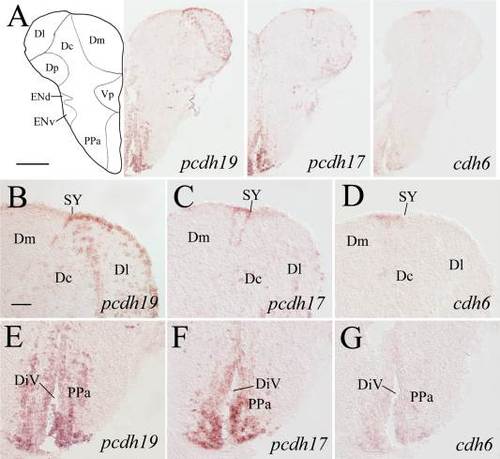
pcdh19, pcdh17, and cdh6 expression in the postcommissural telencephalon and anterior preoptic areas. Images in the top panels are low magnified views of adjacent brain sections from a level shown in Fig. 1. B–D: Higher magnifications of the dorsal telencephalon region adjacent to the sulcus ypsiloniformis (SY) shown in their respective top panels. E–G: Magnified views of the ventral regions (part of the preoptic area) of their respective brain sections in the top panels. For other abbreviations, see list. Scale bar = 200 µm for the top panels, 50 µm for the lower panels. EXPRESSION / LABELING:
|
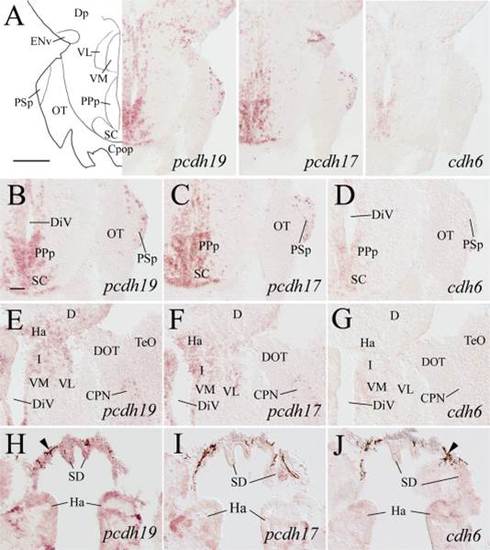
Expression of pcdh19, pcdh17, and cdh6 in the posterior preoptic areas, epithalamus, ventral thalamus, and pretectum. Top panel images show low magnifications of the brain from adjacent sections at a level indicated in Fig. 1. B–D: Higher magnifications of the posterior preoptic areas and the suprachiasmatic nucleus (SC) shown in the top panels. The remaining panels are from sections 100–150 µm posterior to those shown in B–D, showing epithalamus and ventral thalamus. Arrowheads in H–J indicate pigmented epithelium. For other abbreviations, see list. Scale bar = 200 µm for the top panels, 50 µm for the lower panels (B–J have the same magnification). EXPRESSION / LABELING:
|
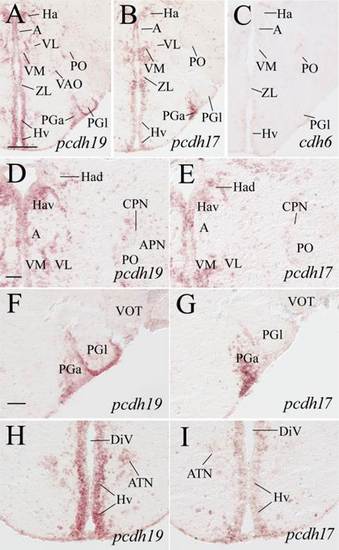
Expression of pcdh19, pcdh17, and cdh6 in habenular, pretectal, dorsal thalamic, ventral thalamic, anterior thalamic, and preglomerular nuclei. Images in top panels show low magnifications of adjacent brain sections from a level shown in Fig. 1. D,E: Higher magnifications of the habenular, ventral thalamic and pretectal regions of their respective images in the top panels. F,G: Higher magnifications of the preglomerular nuclei, while H,I are magnified views of the anterior hypothalamus shown in the top panels. See list for abbreviations. Scale bar = 200 µm for the top panels, 50 µm for the lower panels (F–I have the same magnification). EXPRESSION / LABELING:
|
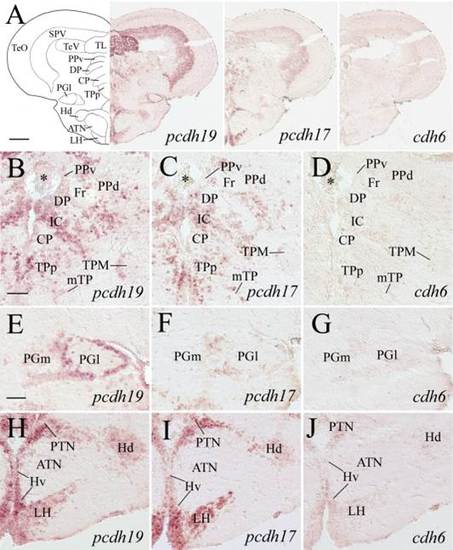
Expression of pcdh19, pcdh17, and cdh6 in the dorsal thalamus, pretectum, preglomerular nuclei, posterior tuberculum, hypothalamus, and optic tectum. Images in the top panels show low magnifications of adjacent sections from a level shown in Fig. 1. B–D: Magnified views of the dorsal thalamus and periventricular pretectum from their respective images in the top panels. E–G: Higher magnifications of the lateral preglomerular (PGl) and medial preglomerular (PGm) nuclei, while H–J are magnified views of the medial hypothalamus and posterior tuberculum shown in their respective top panels. Asterisks in B–D indicate clusters of cells in the diencephalic ventricle. For other abbreviations, see list. Scale bar = 200 µm for the top panels, 50 µm for the lower panels (E–J have the same magnification). EXPRESSION / LABELING:
|
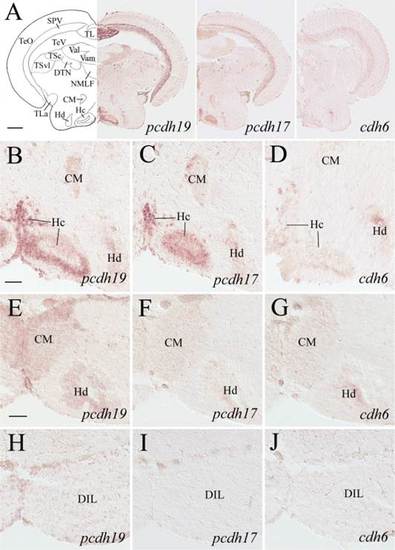
pcdh19, pcdh17, and cdh6 expression in the optic tectum, posterior tuberculum and hypothalamus. Top panels show low magnifications of sections from a level indicated in Fig. 1. The section processed for cdh6 in situ hybridization was from a different fish showing similar hypothalamic areas. B–D: Higher magnifications of the ventral posterior tuberculum and medial hypothalamus from their respective images in the top panels. E–J: Higher magnifications of similar regions from sections posterior to those shown in the top panels: E–G are 100–150 µm posterior to B–D, while H–J are 100–150 µm posterior to E–G. See list for abbreviations. Scale bar = 200 µm for the top panels, 50 µm for the remaining panels (B–J have the same magnification). EXPRESSION / LABELING:
|
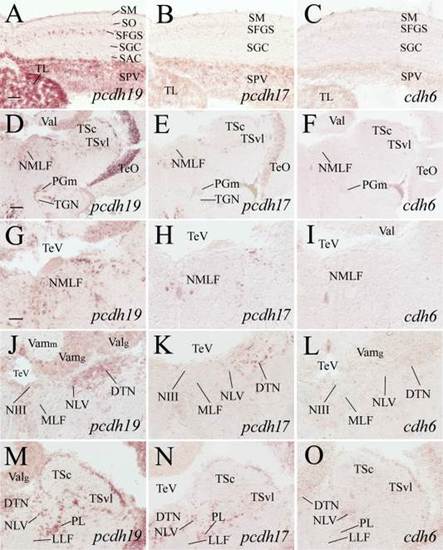
Expression of pcdh19, pcdh17, and cdh6 in the optic tectum, dorsal tegmentum, isthmus, and cerebellar valvula. A–C: Higher magnifications of adjacent sections of the medial optic tectum from images shown in the top panels in Fig. 7. D–F: Low magnified views of dorsal tegmental region of adjacent sections at a level shown in Fig. 1. G–I: Higher magnifications of the nucleus of medial longitudinal fascicle (NMLF) of their respective images in D–F. J–O: Magnified views of the dorsal tegmentum and isthmus from sections posterior (120–150 µm) to D–F, with J–L showing the medial region, while M–O showing the lateral region. See list for abbreviations. Scale bar = 100 µm for D–F, 50 µm for the remaining panels (G–O have the same magnification). EXPRESSION / LABELING:
|

Expression of pcdh19, pcdh17, and cdh6 in the tegmentum, isthmus, cerebellar valvula, and anterior medulla. A-C: From adjacent sections from a level indicated by Fig. 1. D-F: Magnified views of the centromedial region, while G-I are higher magnifications of the dorsolateral region of their respective images in the top panels. J-L and M-O show similar respective regions from sections posterior (120-160 µm) to those shown in D-I. P-R: Higher magnifications of similar areas shown in J-L, but from sections 30-50 µm posterior to J-L. The two asterisks in R indicate a large artificial crack in the tissue. See list for abbreviations. Scale bar = 100 µm for A-C, 50 µm for the remaining panels (D-R have the same magnification). EXPRESSION / LABELING:
|
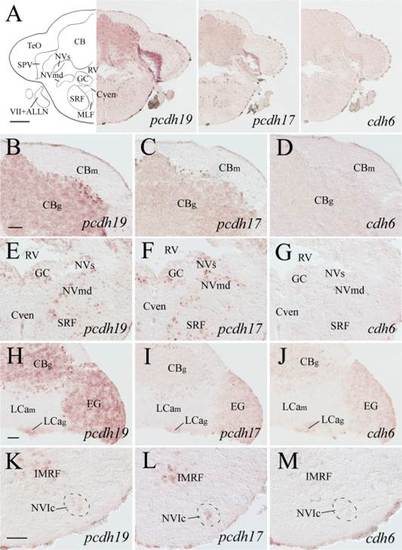
pcdh19, pcdh17, and cdh6 expression in the cerebellum and anterior medulla oblongata. Images at the top panels show low magnified views of cerebellar body (CB) and anterior medulla of adjacent sections from a level shown in Fig. 1. B–D: Higher magnifications of the dorsal half of the CB, while E–G are higher magnified views of the dorsomedial medulla of their respective images shown in the top panels. H–J: Higher magnifications of the cerebellum from adjacent sections located 120–170 µm posterior to A–G. K–M: Higher magnifications of the ventral medulla of adjacent sections from the same level as H–J. For other abbreviations, see list. Scale bar = 200 µm for the top panels, and 50 µm for the remaining panels (B–G have the same magnification). EXPRESSION / LABELING:
|
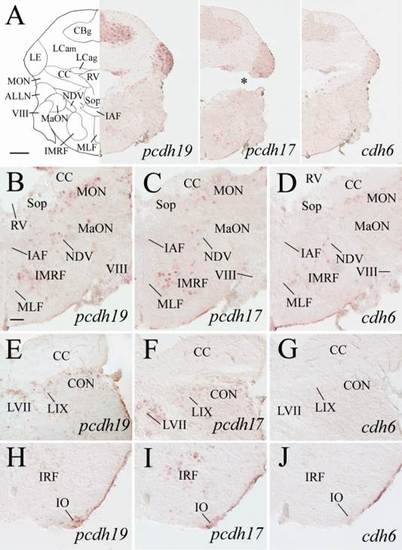
Expression of pcdh19, pcdh17, and cdh6 in the cerebellum and medulla oblongata. Top panels show lower magnifications of adjacent sections from a level shown in Fig. 1. B–D: Higher magnified views of ventral halves of their respective images in the top panels. E–J: From sections 200–250 µm posterior to A. E–G show magnified views of cerebellar crest (CC) and dorsal medulla, while H–J are magnified views of the ventral medulla. The asterisk in A (middle panel) indicates an artificial crack in the tissue section. For other abbreviations, see list. Scale bar = 200 µm for the top panels, and 50 µm for the remaining panels (B–J have the same magnification). EXPRESSION / LABELING:
|
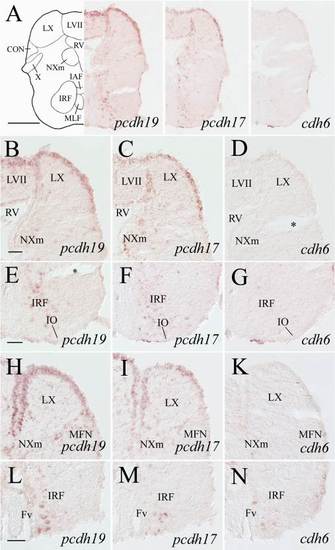
pcdh19, pcdh17, and cdh6 expression in the medulla oblongata. Top panels show low magnifications of adjacent sections from a level shown in Fig. 1. B–D: Higher magnified views of the dorsal halves, while E–G are ventral portions of their respective images in the top panels. H–N: From sections 200–250 µm posterior to A, with H–K showing magnified views of the dorsal medulla, while L–N showing the ventral medulla. Asterisks in D and E indicate artificial cracks in the sections. See list for abbreviations. Scale bar = 200 µm for the top panels, 50 µm for the remaining panels (E–K have the same magnification). EXPRESSION / LABELING:
|

Expression of pcdh19, pcdh17, and cdh6 in the posterior medulla and anterior spinal cord. Top panels show lower magnifications of adjacent sections from a level shown in Fig. 1. B–D: Higher magnifications of the dorsal regions, while E–G are higher magnifications of the ventral regions of their respective images in the top panels. H–J: Adjacent sections from the spinal cord at the cervical level. The arrow in B indicates a fold in the tissue. See list for abbreviations. Scale bar = 200 µm for the top panels, 50 µm for the remaining panels. EXPRESSION / LABELING:
|