
|
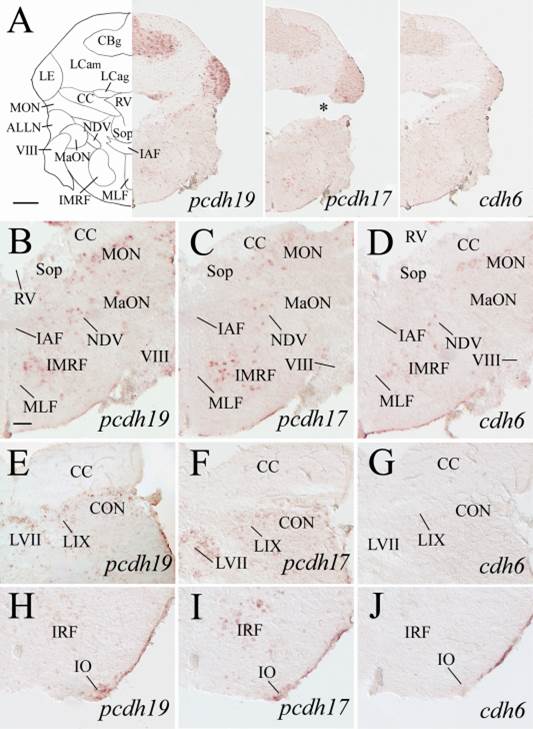
Fig. 12
Expression of pcdh19, pcdh17, and cdh6 in the cerebellum and medulla oblongata. Top panels show lower magnifications of adjacent sections from a level shown in Fig. 1. B–D: Higher magnified views of ventral halves of their respective images in the top panels. E–J: From sections 200–250 µm posterior to A. E–G show magnified views of cerebellar crest (CC) and dorsal medulla, while H–J are magnified views of the ventral medulla. The asterisk in A (middle panel) indicates an artificial crack in the tissue section. For other abbreviations, see list. Scale bar = 200 µm for the top panels, and 50 µm for the remaining panels (B–J have the same magnification).