
|
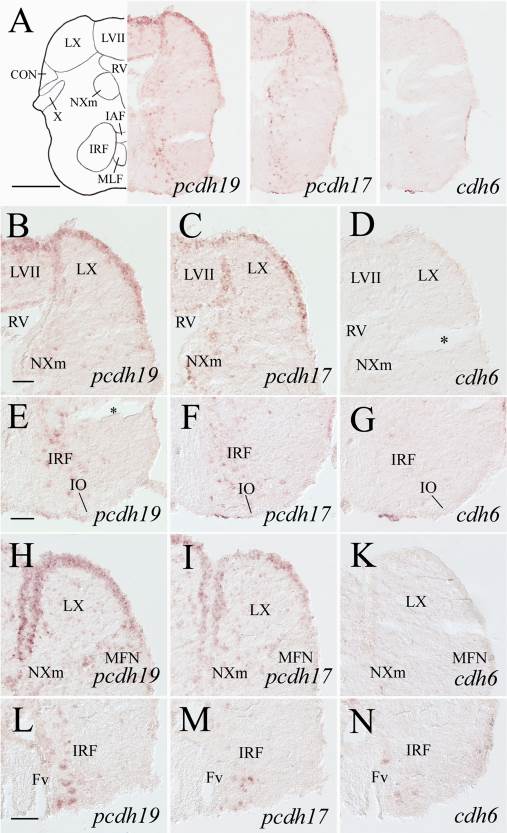
Fig. 13
pcdh19, pcdh17, and cdh6 expression in the medulla oblongata. Top panels show low magnifications of adjacent sections from a level shown in Fig. 1. B–D: Higher magnified views of the dorsal halves, while E–G are ventral portions of their respective images in the top panels. H–N: From sections 200–250 µm posterior to A, with H–K showing magnified views of the dorsal medulla, while L–N showing the ventral medulla. Asterisks in D and E indicate artificial cracks in the sections. See list for abbreviations. Scale bar = 200 µm for the top panels, 50 µm for the remaining panels (E–K have the same magnification).