
|
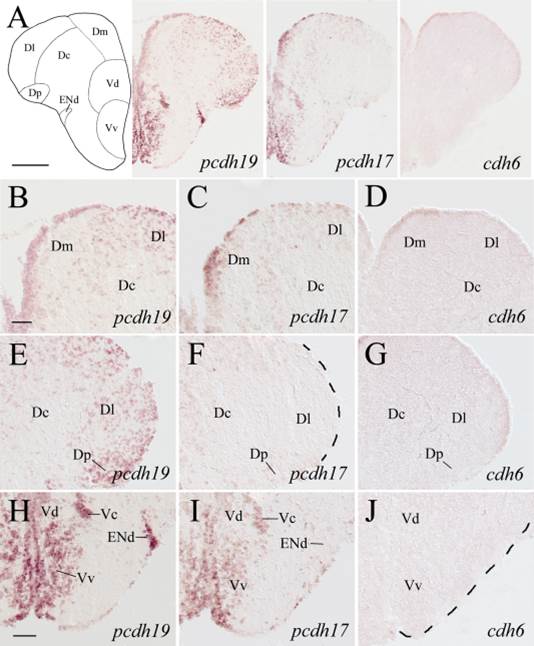
Fig. 3
Expression of pcdh19, pcdh17, and cdh6 in the precommissural telencephalon. Images in the top panels show low magnified views of adjacent brain regions at a level shown in Fig. 1. B–D: Higher magnifications of the dorsomedial regions of the dorsal telencephalon, while E–G show higher magnified views of the dorsolateral regions of the dorsal telencephalon shown in the top respective panels. H–J: Higher magnifications of the ventral regions of the telencephalon shown in the top panels. See list for abbreviations. Scale bar = 200 µm for the top panels, 50 µm for the lower panels (B–G have the same magnification).