
|
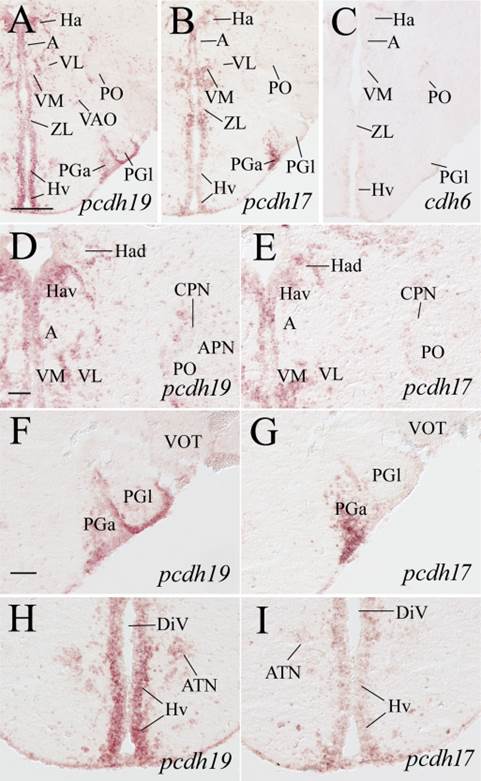
Fig. 6
Expression of pcdh19, pcdh17, and cdh6 in habenular, pretectal, dorsal thalamic, ventral thalamic, anterior thalamic, and preglomerular nuclei. Images in top panels show low magnifications of adjacent brain sections from a level shown in Fig. 1. D,E: Higher magnifications of the habenular, ventral thalamic and pretectal regions of their respective images in the top panels. F,G: Higher magnifications of the preglomerular nuclei, while H,I are magnified views of the anterior hypothalamus shown in the top panels. See list for abbreviations. Scale bar = 200 µm for the top panels, 50 µm for the lower panels (F–I have the same magnification).