
Image
|
Figure Caption
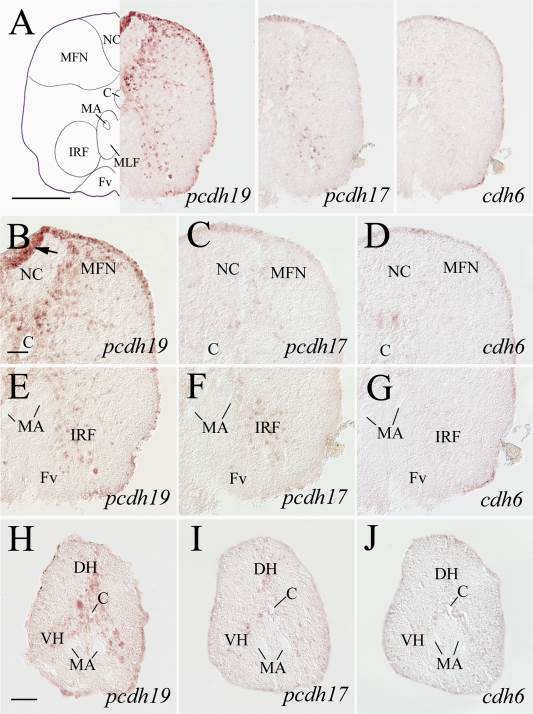
Fig. 14
Expression of pcdh19, pcdh17, and cdh6 in the posterior medulla and anterior spinal cord. Top panels show lower magnifications of adjacent sections from a level shown in Fig. 1. B–D: Higher magnifications of the dorsal regions, while E–G are higher magnifications of the ventral regions of their respective images in the top panels. H–J: Adjacent sections from the spinal cord at the cervical level. The arrow in B indicates a fold in the tissue. See list for abbreviations. Scale bar = 200 µm for the top panels, 50 µm for the remaining panels.
Figure Data
Acknowledgments
This image is the copyrighted work of the attributed author or publisher, and
ZFIN has permission only to display this image to its users.
Additional permissions should be obtained from the applicable author or publisher of the image.
Full text @ J. Comp. Neurol.