
|
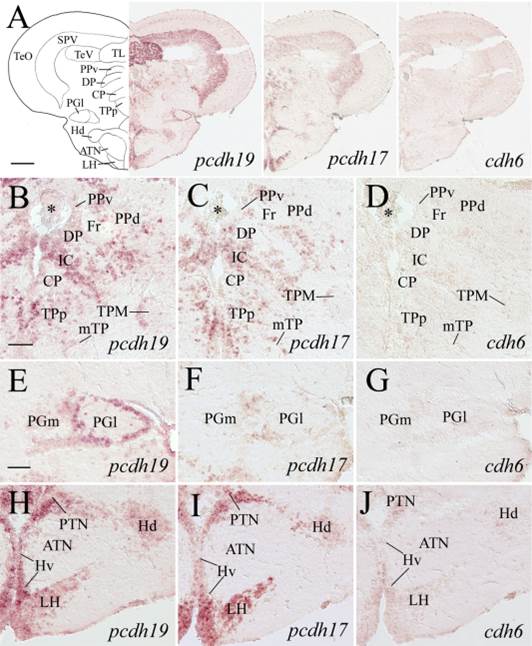
Fig. 7
Expression of pcdh19, pcdh17, and cdh6 in the dorsal thalamus, pretectum, preglomerular nuclei, posterior tuberculum, hypothalamus, and optic tectum. Images in the top panels show low magnifications of adjacent sections from a level shown in Fig. 1. B–D: Magnified views of the dorsal thalamus and periventricular pretectum from their respective images in the top panels. E–G: Higher magnifications of the lateral preglomerular (PGl) and medial preglomerular (PGm) nuclei, while H–J are magnified views of the medial hypothalamus and posterior tuberculum shown in their respective top panels. Asterisks in B–D indicate clusters of cells in the diencephalic ventricle. For other abbreviations, see list. Scale bar = 200 µm for the top panels, 50 µm for the lower panels (E–J have the same magnification).