
- Title
-
Alterations of the cytoskeleton in all three embryonic lineages contribute to the epiboly defect of Pou5f1/Oct4 deficient MZspg zebrafish embryos
- Authors
- Lachnit, M., Kur, E., and Driever, W.
- Source
- Full text @ Dev. Biol.
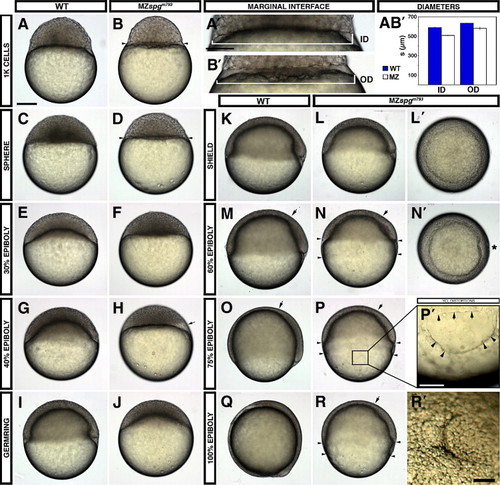
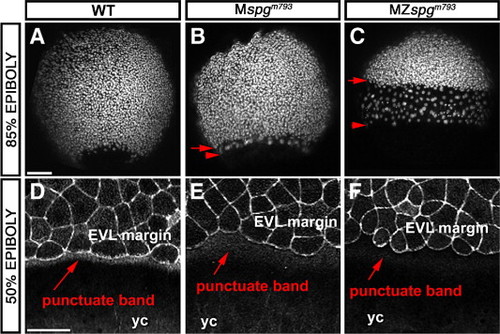
Live phenotype of MZspg embryos reveals severe gastrulation defects. (A–D) At the onset of cell motility, MZspgm793 embryos display a smaller blastoderm with an enhanced constriction between DEL/EVL and YSL and an enlarged YSL (small arrowheads). (A′, B′) Higher magnification of the outer (interface between DEL and YSL) and inner (interface between YSL and YCL) diameter of WT versus MZspgm793. (A, B′) Measurements of the diameters including SE. Inner diameter (ID): MZspgm793: 508 ± 2 μm, WT: 587 ± 4 μm; p = 4 · 10- 10. Outer diameter (OD): MZspgm793 = 576 ± 7 μm, WT = 635 ± 2 μm; p = 1 · 10- 05. (E–H) While the blastoderm in WT starts spreading over the yolk, mutant blastoderm sits on the yolk cell showing translucent deep cell areas (H, arrow). (I, J) A 30% epiboly progress can be detected in MZspgm793 when WT reach germ ring stage. (M, N, N′) At 60% epiboly mutant embryos display a widening gap (arrowheads) between EVL and DEL margin and a small malformed shield (N′, animal view, *). (N, P, R) Vegetally migrating deep cells and anteriorly migrating hypoblast cells in mutant embryos show retardation (arrow marking the leading edge of the anterior mesendoderm). (P2) Higher magnification of the mutant YCL showing cortical clefts (arrowheads); arrows indicate EVL margin. (Q, R) At the end of epiboly, the DEL as well as the EVL appears strongly retarded in MZspgm793. EVL cells seem to have reached about 75–80% epiboly, while deep cells seem not to have passed 50% epiboly. (R2) Animal view of mutant embryos shows a polster like formation. Staging of live embryos has been repeated in three indeE. EVL cells seem to have reached about 75–80% epiboly, while deep cells seem not to have passed 50% epiboly. (R2) Animal view of mutant embryos shows a polster like formation. Staging of live embryos PHENOTYPE:
|
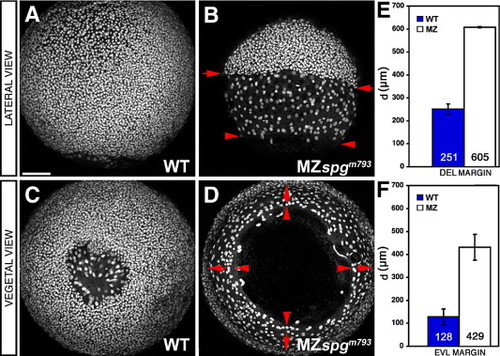
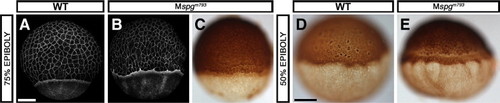
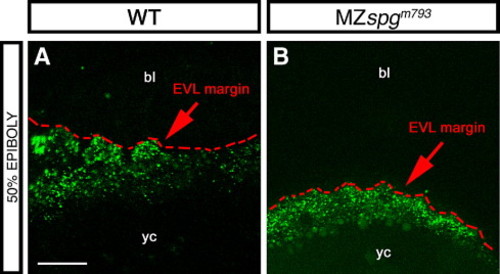
Epiboly delay of the DEL and EVL. (A–D) Confocal z-projections of Sytox green stained embryos at 85% epiboly stage. MZspgm739 embryos show a strong DEL (arrows) and EVL (arrowheads) retardation. (A, B) Lateral and (C, D) vegetal views. (E) Measurements of the mean diameter “d” of diametral DEL margins: WT = 251 ± 26 μm, MZspgm793 = 605 ± 6 µm, p = 2 · 10- 08. (F) Measurements of the mean diameter “d” of diametral EVL margins: WT = 128 ± 31 μm, MZspgm739 = 429 ± 13 µm (p = 1 · 10- 06). Scale bar: 100 μm. PHENOTYPE:
|
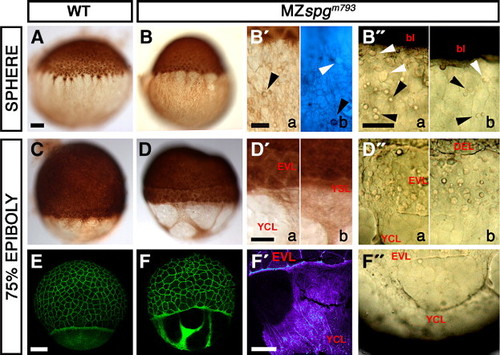
Distorted yolk cell cortical layer integrity. (A–D, B′, D′) Anti-β-Tubulin/DAB staining of the cortical Tubulin network in MZspgm793 and WT embryos, as indicated. (B2b) Combined Höchst33342/anti-β-Tubulin-antibody/DAB stainings of MZspgm793 embryos showing small spheres (arrowheads) located within the cortical layer of non-nuclear origin. (B″) Small cortical spheres (arrowheads) in a living MZspgm793 embryo. (C, D) Shield stage. (D) Formation of a gap between DEL and EVL in MZspgm793 embryos. (D, D′) Anti-Tubulin stained embryos reveal cortical layer distortions with areas that appear devoid of a cytoplasmic layer. (D″, F″) Cortical layer distortions in living MZspgm793 embryos (arrowhead). (E, F) Confocal z-projections of Alexa488-Phalloidin stained embryos visualize Actin filament distribution. (F) Distortions of the punctuate band and the continuous Actin deposition in the YCL in MZspgm793 embryos. (F′) Color depth-coded projection of confocal image stack. Subpanels in panels B2, B″, D′, and D″: (a) strong, (b) mild phenotypes. bl: blastoderm, EVL: enveloping layer, DEL: deep cell layer, YCL: yolk cytoplasmic layer, YSL: yolk syncytial layer. Scale bar: 100 μm. PHENOTYPE:
|
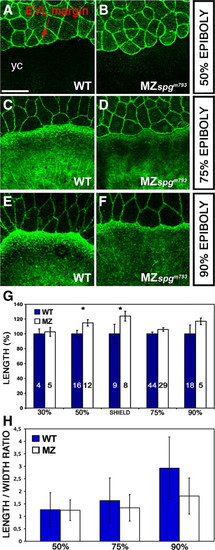
Delay in cell shape changes of marginal EVL cells. (A–F) Confocal z-projections of Alexa488-Phalloidin stained embryos showing a delay in flattening of marginal EVL cells. (A, C, E) WT; (B, D, F) MZspgm793 embryos. (A, B) 50% epiboly; (C, D) 75% epiboly; (E, F) 90% epiboly. All MZspgm793 stages are time-matched to wild-type embryos. yc: yolk cell. Scale bar: 100 μm. (G) Measurements of the average border cell length of 10–15 marginal EVL cells including SE. 30% epiboly: WT = 100 ± 8%; MZspgm793 = 103 ± 6% (p = 0.205). 50% epiboly: WT = 100 ± 5%; MZspgm793 = 115 ± 4% (p = 0.029). Shield stage: WT = 100 ± 4%; MZspgm793 = 124 ± 7% (p = 0.011). 75% epiboly: WT = 100 ± 2%; MZspgm793 = 246 ± 2% (p = 0.069). 90% epiboly: WT = 100 ± 12%; MZspgm793 = 117 ± 5 (p = 0.122). Data were normalized on WT results set as 100%. Asterisks highlight significant differences. (H) Measurements of the length to width ratio of marginal EVL cells. For each stage the length to width ratio of 10 adjacent cells was determined in 10 embryos of each wild-type or MZspgm793. The graph represents average data from 100 cells for each genotype and stage, bars indicate standard deviation. 50% epiboly: MZspgm793 = 1.24 ± 0.42; WT = 1.26 &p00 cells for each genotype and stage, bars indicate standard deviation. 50% epiboly: MZspgp = 0.8004; paired Student′s t-Test); 75% epiboly: MZspgm793: 1.34 ± 0.53; WT = 1.63 ± 0.90 (p = 0.2349); 90% epiboly: MZspgm793 = 1.81 ± 0.72; WT = 2.93 ± 1.25 (p PHENOTYPE:
|
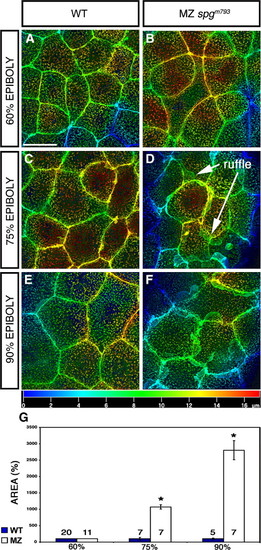
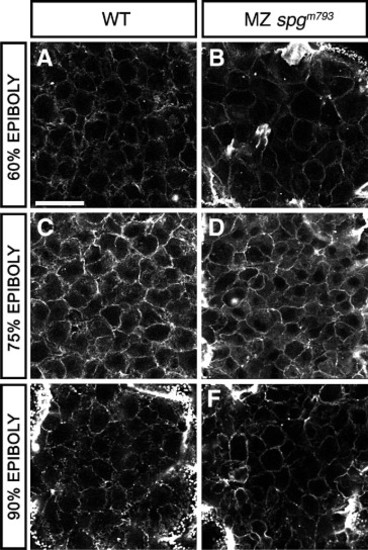
Enhanced lamellipodia formation of EVL cells. Animal pole confocal z-projections of Alexa488-Phalloidin stained embryos during epiboly. (A–F) EVL cells. (A, C, E) WT EVL cells with few detectable lamellipodia. (B, D, F) MZspgm793 EVL cells with enhanced lamellipodia formation at the cell–cell contact site of EVL cells, projecting toward the deep cells, (A, B) at 60% epiboly, (C, D) at 75% epiboly, and (E, F) at 90% epiboly. Images show z-projections of confocal stacks of images using the depth coding method, to visualize the localization of lamellipodia. Depth scale bar is depicted beneath panels E and F. Scale bar: 20 μm. (G) Measurements of the lamellipodia area including SE: 60% epiboly: WT = 100 ± 0%, MZspgm793 = 100.75 ± 0% (no lamellipodia detectable). 75% epiboly: WT = 100 ± 40%; MZspgm793 = 1072 ± 67% (p = 3.157 · 10- 08). 90% epiboly: WT = 100 ± 20%; MZspgm793 = 2804 ± 290% (p = 2.563 · 10- 06). Measurements were performed with Volocity software. Data were normalized to WT results which was set as 100%. Asterisks highlight significant differences. Number of analyzed embryos is depicted within or above bars. PHENOTYPE:
|
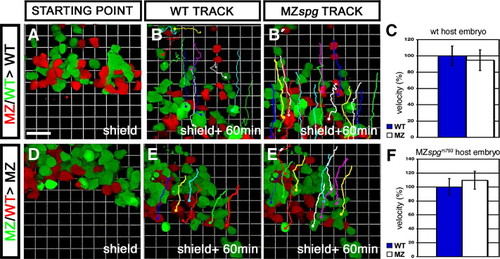
Non-cell autonomous delay of DEL cell migration in MZspg embryos. Confocal z-stack time lapse recordings of mosaic embryos, starting at shield stage for 60 min. An approximately equal amount of cells from WT and MZspgm793 donors labeled with different fluorescent dyes were collected and co-transplanted into the ventral margin of a non-labeled host. Donors were either labeled with Alexa488-dextran (MW: 10 kDa) or Alexa546-dextran (MW: 10 kDa). (A, B) Cells transplanted into a WT host. (D, E) Cells transplanted into a MZspgm793 host. (B, E) Tracking lines of transplanted WT cells. (B′, E′) Tracking lines of transplanted MZspgm793 cells at the end of the time lapse. (C, F) Measurements of the net velocity of 10–20 transplanted cells. Velocity was normalized on WT velocity and depicted as % of WT data including standard deviation. (C) Net velocity of cells in a WT environment (n = 4): WT = 100 ± 12%; MZspgm793 = 95 ± 13%; p = 0.828. (F) Net velocity of cells in a pou5f1 deficient environment (n = 2): WT = 100 ± 22%; MZspgm793 = 110 ± 18%; p = 0.825. No significant difference in velocity was observed. Scale bar: 46.2 μm (Movies S1 and S2). |
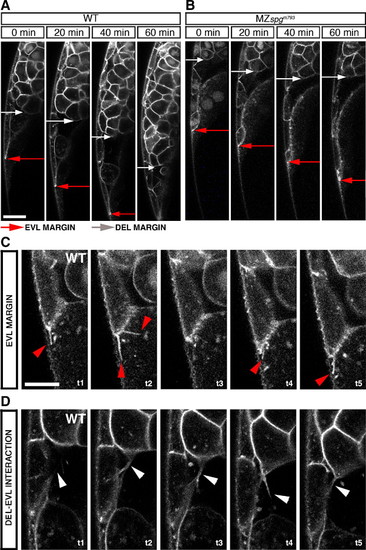
Behavior of cells at the ventral margin. (A–D) Live phenotype observations of the ventral leading edge during a time course of 60 min. Membrane tagged GFP/Sytox green labeled embryos were monitored by confocal z-section time lapse analysis during a time course of 1 h starting at 60% epiboly stage. Red arrows mark the EVL leading edge, white arrows the DEL leading edge. (A) Shows the WT leading edge. (B) Shows the MZspgm793 leading edge. (C) Filopodia formation at the interface between EVL and YSL in a WT embryo (red arrowheads). Δt = 100 s. (D) Filopodia formation between DEL, EVL in WT (white arrowheads). Δt = 250 s. (A, B) Scale bar: 100 μm. (C, D) Scale bar: 50 μm (see also Movies S3, S4, and S5). PHENOTYPE:
|
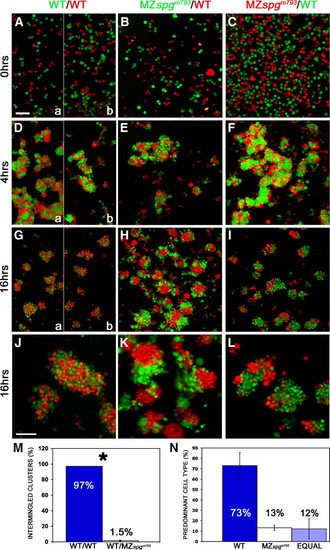
Altered adhesive properties of pou5f1 deficient cells. Embryos were labeled by microinjection at one cell stage either with Rhodamine-dextran (MW: 10 kDa) or Alexa488-dextran (MW: 10 kDa), and primary co-cultures of dissociated and mixed sphere stage embryo cells were plated on Fibronectin/Collagen coated dishes. Volume rendering of confocal stacks of cultures: (A–C) dissociation control after plating, (D–F) after 4 h, (G–I) after 16 h incubation. (J–L) Higher magnification of cell aggregates. (J) Intermingled status of homogeneous WT–WT clusters. (K, L) Distinct subcluster formation of heterogeneous WT-MZ clusters. (M) Measurements of the percentage of intermingled clusters including standard error: WT–WT co cultures showed in 97 ± 0% intermingled clusters, WT-MZspgm793 co-cultures in 1.5 ± 0.7%; p = 0.004. (N) Predominant cell types in heterogeneous clusters. WT cells = 73 ± 12.5%; MZspgm793 cells = 13.2 ± 2.5%; equal contribution of cell types = 12.2 ± 9.8%. In panels A, D, and G, the left (a) half images show WT control performed for the experiment in panels B, E, H, and K, and right (b) for panels C, F, I, and J. Scale bars: (A–I) 100 μm; (J–L) 50 μm. PHENOTYPE:
|
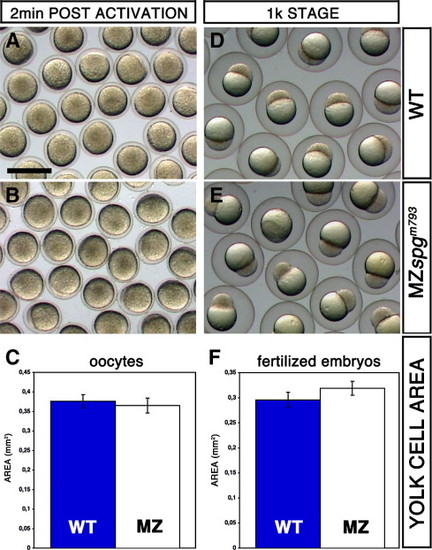
Comparison of the egg size of WT and MZspgm793 embryos. Embryos were obtained by in vitro fertilization. (A, B) Unfertilized oocytes 2 min after activation in egg water and (D, E) fertilized embryos at 1000 cell stage. (A, D) WT and (B, E) MZspgm793. The image area of the activated oocytes or the yolk cell area was traced and measured using ImageJ software (C, F). Oocytes and embryos at 1 k stage showing no significant difference in size when WT and MZspgm793 embryos are compared. (C) oocytes: WT = 0.38 ± 0.02 mm2; (E) MZspgm793 = 0.37 ± 0.02 mm2. (F) Measurement of the yolk cell area at 1 k stage. WT = 0.30 ± 0.01 mm2; MZspgm793 = 0.32 ± 0.01 mm2. Scale bar in A: 1 mm. PHENOTYPE:
|
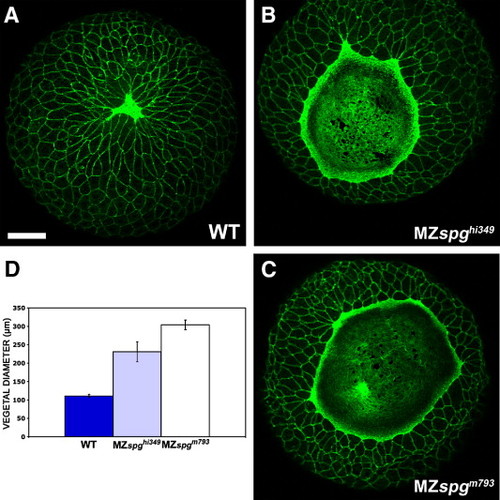
Comparison of delay in EVL epiboly in MZspghi349 and MZspgm793 embryos. Embryos were stained with Alexa488-Phalloidin and z-projections of confocal z-stacks generated. (A-C) Vegetal view of 95% epiboly stage embryos. (A) WT; (B) MZspghi349; (C) MZspgm793. Scale bar in A (for A-C): 100 μm. (D) Measurement of the distance between opposing EVL margins including SE. WT = 111 ± 4.2 μm; MZspghi349 = 231 ± 27 ¼m; MZspgm793 = 304 ± 13 µm. Scale bar: 20 μm. PHENOTYPE:
|
Maternal Pou5f1 impact on the DEL and EVL phenotype. (A–C) Z-projection of confocal image stacks of 85% epiboly embryos stained with Sytox green to visualize nuclei. (A) WT; (B) Mspgm793; (C) MZspgm793. A delay of EVL and DEL is detectable based on altered distribution of nuclei. (D–F) Higher magnification of the EVL margin of confocal z-projections of Alexa488-Phallodin stained embryos. (D) WT; (E) Mspgm793; (F) MZ spgm793. Note delay in change of marginal EVL cell shape and reduced stain intensity of the punctate F-Actin band in the YSL. yc: yolk cell. Scale bar: 100 μm. PHENOTYPE:
|
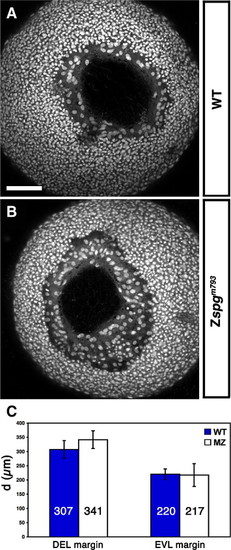
Zygotic Pou5f1 impact on DEL and EVL vegetal closure progression. (A–B) Z-projection of confocal image stacks of a vegetal view of embryos at approximately 90% epiboly stage stained with Sytox green to visualize nuclei. (A) Wild-type (B) Zspgm793. (C) Measurement of the distance of opposing DEL and EVL margins. DEL cells of Zspgm793 displayed an average distance of 341 ± 31 μm and those of wild-type siblings 307 ± 31 μm (p < 0.160) The distance of opposing EVL margins was 220 ± 40 μm in wild-type and 217 ± 19 μm in Zspgm793 (p < 0.951). Embryos resulted from the cross female spg/+x male spg/spg or from the cross female spg/+x male spg/+. The genotypes of embryos were identified after confocal data acquisition by PCR. Scale bar: 100 μm. PHENOTYPE:
|
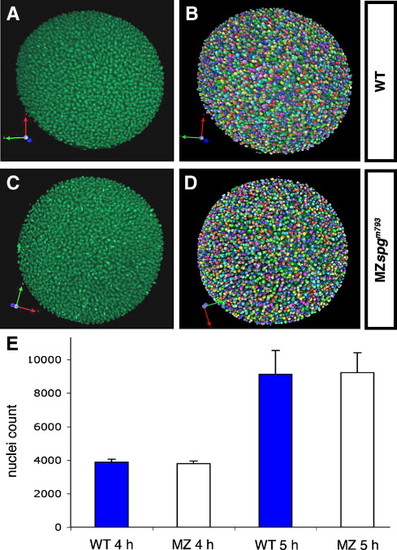
Nuclei counts at same developmental times are similar in wild-type and MZspg mutant embryos during early gastrula stages. Precisely staged embryos were obtained, fixed, and nuclei stained with Sytox Green. (A, C) Z-projections of animal views of wild-type and MZspgm793 mutant embryos. (B, D) Detection of Sytox Green stained nuclei by Volocity software: individual volumes representing stained nuclei are assigned different colors. (E) Nuclei counts for wild-type and MZspg mutant embryos at 4 hpf and 5 hpf. Actual values for individual embryos are: 4 hpf: WT: 4009, 3744, mean: 3877, standard deviation: 187; MZspgm793: 3911, 3683, mean: 3797, standard deviation: 161; 5 hpf: WT: 8154, 8516, 7680, 10804, 10502, mean: 9131, standard deviation: 1424; MZspgm793: 10636, 9220, 8401, 7931, 9984, mean: 9234, standard deviation: 1190. There is no significant difference in nuclei counts between wild-type and MZspgm793mutant embryos. Student's t-test for 5 hpf: t = 0.128, p = 0.9. PHENOTYPE:
|
Maternal contribution to the YCL phenotype. (A, B) Alexa488-Phalloidin staining. (C–E) Anti-β-Tubulin antibody immunohistochemistry with secondary antibody/HRP/DAB detection. (A–C) 75% epiboly, (D, E) 50% epiboly embryos. (A, D) WT; (B, C, E) Mspgm793. (E) Microtubule track formation in Mspgm793 embryos is slightly distorted, but microtubule free patches are not observed. Scale bars: 100 μm. EXPRESSION / LABELING:
PHENOTYPE:
|
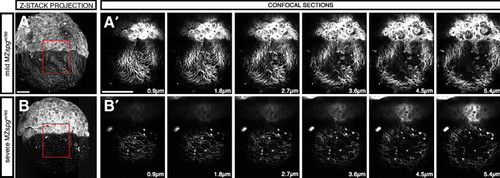
Excessive formation of cortical layer spherical structures. (A, B) Z-projection of anti-β-Tubulin immunofluorescence stain (Alexa488 conjugated α mouse-Ab) of MZspgm793 embryos. (A′, B′) Confocal slices depicting sphere localization within the cortical layer. (A) Mild MZspgm793 phenotype. (B) Severe MZspgm793 phenotype. Scale bar: 100 μm. |
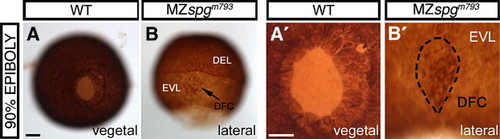
Forerunner cells undergo epiboly ahead of DEL cells in MZspgm793. (A, B) Anti-β-Tubulin-HRP/DAB immunohistochemistry. (A, A′) WT, vegetal; (B, B′) MZspgm793, lateral view. (B, B) Forerunner cell localization (DFC) in MZspgm793. Scale bars: 100 μm. EXPRESSION / LABELING:
|
Endocytosis at the YSL-EVL interface. (A, B) Lucifer Yellow soaked 50% epiboly embryos showing vesicle trafficking at the margin. (A) WT; (B) MZspgm793. Z-projection of confocal image stacks; dotted line indicates vegetal margin of EVL. Orientation: animal pole at top. bl: blastoderm, yc: yolk cell. Scale bar: 50 μm. PHENOTYPE:
|
DEL cell morphology. Animal pole view confocal z-projections of Alexa488-Phalloidin stained embryos during epiboly. (A–F) Confocal sections of the DEL. A, C, and E show WT DEL cells. B, D, and F show MZspgm793 DEL cells. (A, B) At 60% epiboly; (C, D) at 75% epiboly; (E, F) at 90% epiboly. DEL morphology appears normal in MZspgm793 embryos. Scale bar: 20 μm. PHENOTYPE:
|
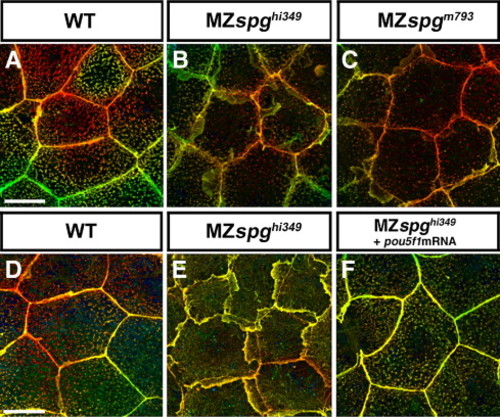
Comparison and rescue of the EVL lamellipodia phenotype. Animal pole view confocal z-projections of Alexa488-Phalloidin stained EVL cells at 90% epiboly, depicted using the depth coding method. (A) WT; (B) MZspghi349; (C) MZspgm793. Extensive lamellipodia formation is observed in both alleles. (D–F) Depicts a rescue experiment showing (D) WT, (E) MZspghi349 non-injected, and (F) MZspghi349 injected with 50 pg pou5f1 mRNA. Genetically MZspghi349 mutant embryos are completely rescued by pou5f1 mRNA injection with respect to their EVL lamellipodia phenotype. Scale bar: 20 μm. PHENOTYPE:
|
Reprinted from Developmental Biology, 315(1), Lachnit, M., Kur, E., and Driever, W., Alterations of the cytoskeleton in all three embryonic lineages contribute to the epiboly defect of Pou5f1/Oct4 deficient MZspg zebrafish embryos, 1-17, Copyright (2008) with permission from Elsevier. Full text @ Dev. Biol.