
|
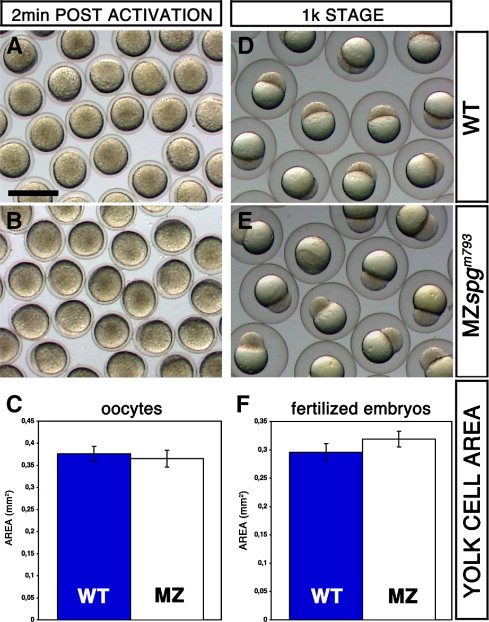
Fig. S1 Comparison of the egg size of WT and MZspgm793 embryos. Embryos were obtained by in vitro fertilization. (A, B) Unfertilized oocytes 2 min after activation in egg water and (D, E) fertilized embryos at 1000 cell stage. (A, D) WT and (B, E) MZspgm793. The image area of the activated oocytes or the yolk cell area was traced and measured using ImageJ software (C, F). Oocytes and embryos at 1 k stage showing no significant difference in size when WT and MZspgm793 embryos are compared. (C) oocytes: WT = 0.38 ± 0.02 mm2; (E) MZspgm793 = 0.37 ± 0.02 mm2. (F) Measurement of the yolk cell area at 1 k stage. WT = 0.30 ± 0.01 mm2; MZspgm793 = 0.32 ± 0.01 mm2. Scale bar in A: 1 mm.
Reprinted from Developmental Biology, 315(1), Lachnit, M., Kur, E., and Driever, W., Alterations of the cytoskeleton in all three embryonic lineages contribute to the epiboly defect of Pou5f1/Oct4 deficient MZspg zebrafish embryos, 1-17, Copyright (2008) with permission from Elsevier. Full text @ Dev. Biol.