
- Title
-
Wnt3 distribution in the zebrafish brain is determined by expression, diffusion and multiple molecular interactions
- Authors
- Veerapathiran, S., Teh, C., Zhu, S., Kartigayen, I., Korzh, V., Matsudaira, P.T., Wohland, T.
- Source
- Full text @ Elife
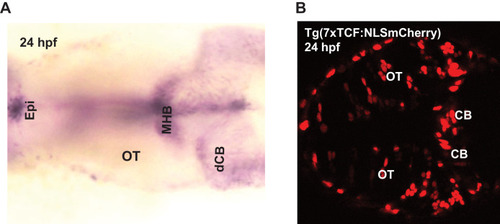
( |
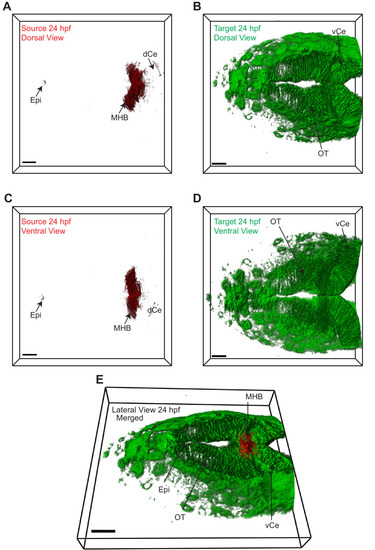
3D dorsal projection of Wnt3 (A) source regions at 24 hpf and (B) target regions at 24 hpf (top view). 3D ventral projection of Wnt3 (C) source regions at 24 hpf and (D) target regions at 24 hpf (bottom view). (E) 3D projection of Wnt3 source and target regions at 24 hpf (lateral view). See Video 3 for a detailed view. dCe, dorsal regions of cerebellum; Epi, epithalamus; MHB, midbrain–hindbrain boundary; OT, optic tectum; vCe, ventral regions of cerebellum. Images orientation: anterior to the left. Scale bar 30 μm. |
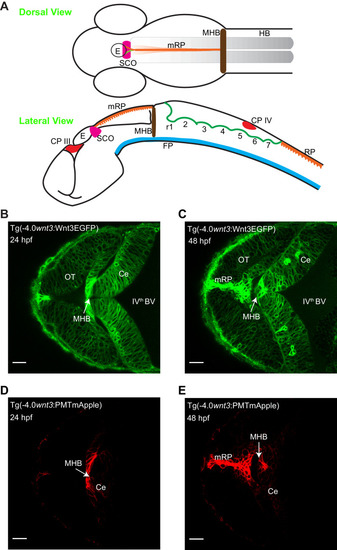
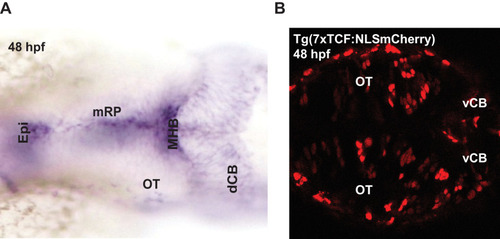
Expression of ( |
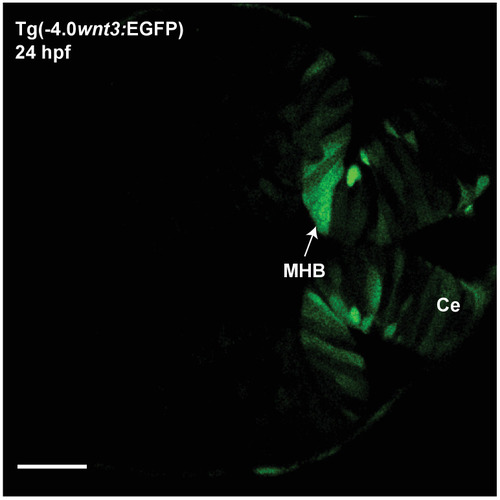
The expression of EGFP in Tg(-4.0 |
( |
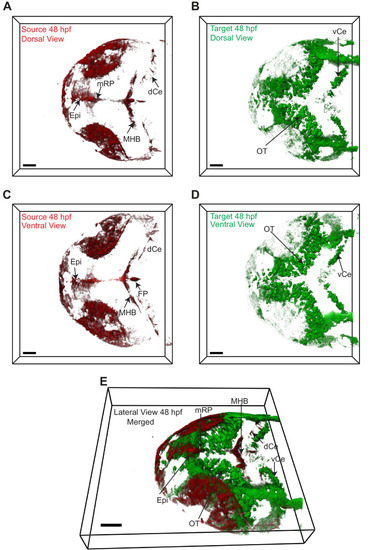
3D dorsal projection of Wnt3 (A) source regions at 48 hpf and (B) target regions at 48 hpf (top view). 3D ventral projection of Wnt3 (C) source regions at 48 hpf and (D) target regions at 48 hpf (bottom view). (E) 3D projection of Wnt3 source and target regions at 48 hpf (lateral view). See Video 4 for a detailed view. dCe, dorsal regions of cerebellum; Epi, epithalamus; FP, floor plate; MHB, midbrain–hindbrain boundary; mRP, midbrain roof plate; OT, optic tectum; vCe, ventral regions of cerebellum. Images orientation: anterior to the left. Scale bar 40 μm. |
Expression of ( |
The expression of EGFP in Tg(-4.0 |
( |
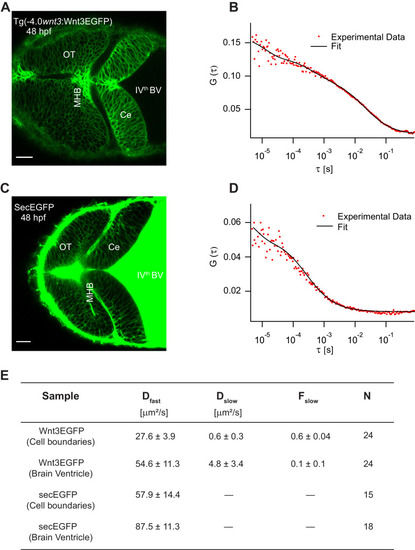
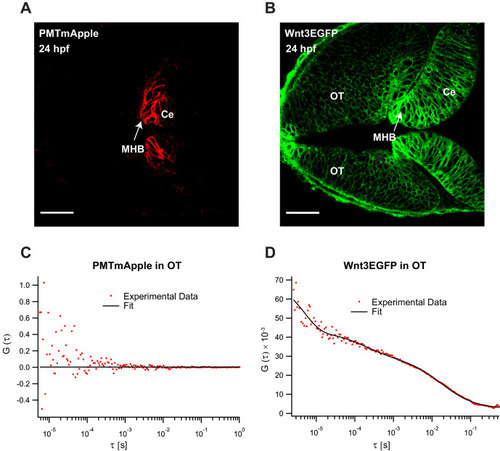
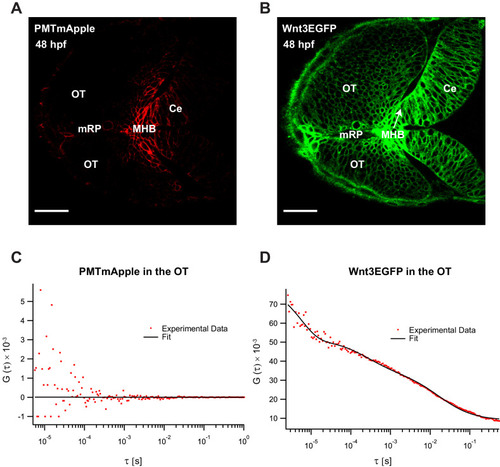
(A) Expression of Wnt3EGFP in Tg(−4.0wnt3:Wnt3EGFP) at 48 hpf. (B) Representative autocorrelation function (ACF; dots) and fitting (line) of a Wnt3EGFP measurement at a cell boundary. (C) Expression of secEGFP in the zebrafish brain at 48 hpf. (D) Representative ACF (dots) and fitting (line) of a secEGFP measurement at a cell boundary. (E) Table showing diffusion coefficients of the fast component (Dfast), slow component (Dslow) and the fraction of slow component (Fslow) for Wnt3EGFP and secEGFP measured by FCS. Measurements were performed in the cell borders of Ce, MHB, and OT; and in the BV. Data are mean ± SD; N = No of measurements. BV, brain ventricle; Ce, cerebellum; MHB, midbrain–hindbrain boundary; OT, optic tectum. Images orientation: anterior to left. Scale bar 30 μm. |
( |
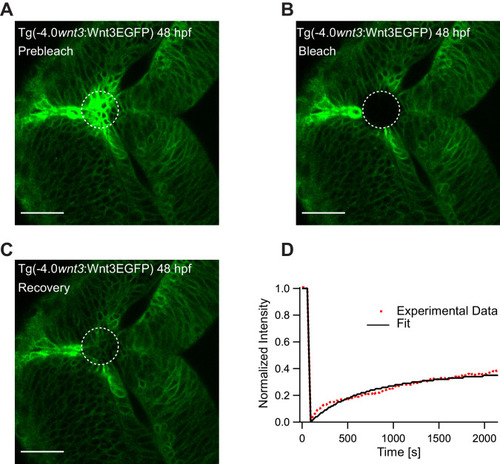
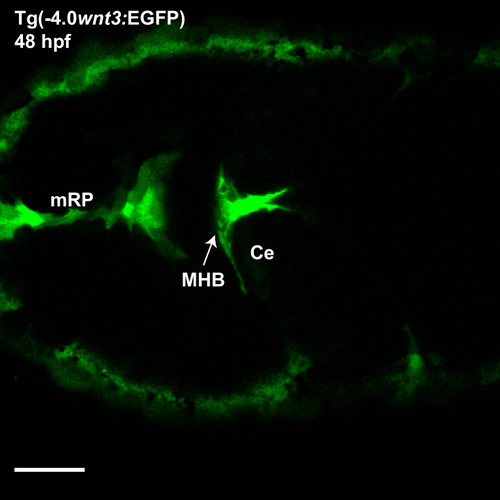
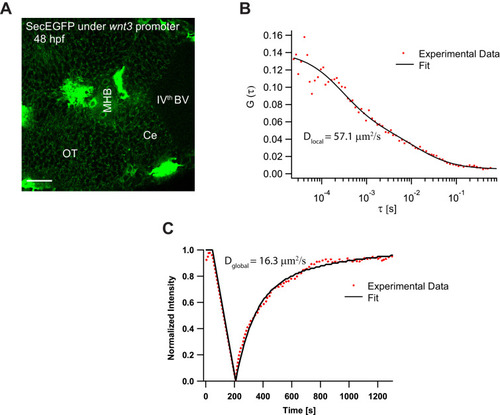
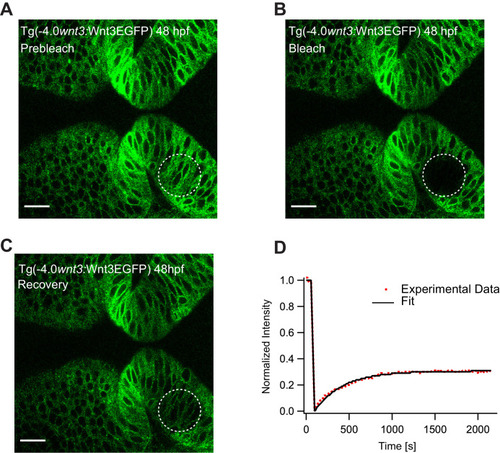
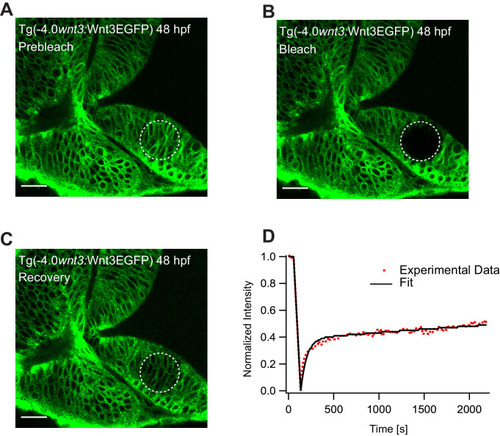
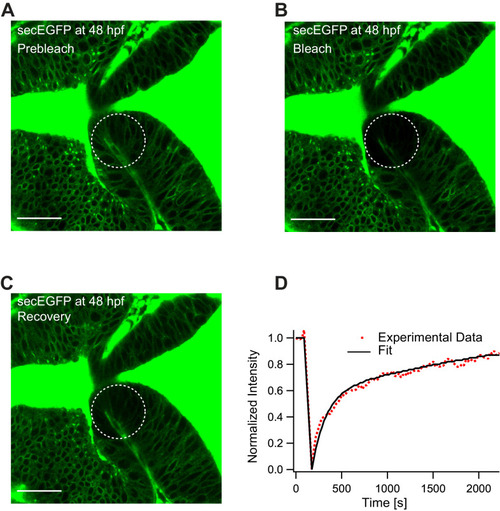
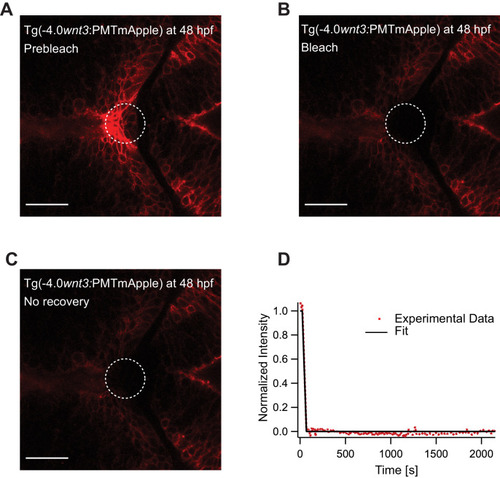
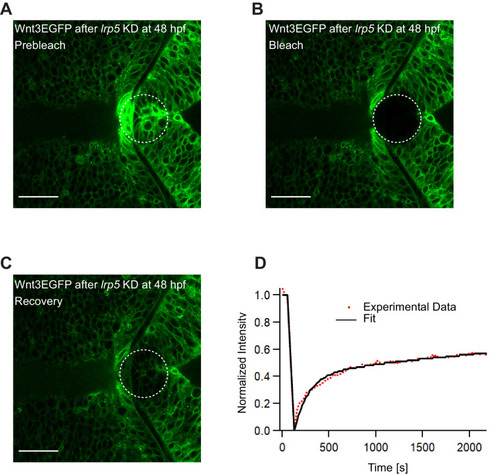
(A) Expression of Wnt3EGFP in Tg(−4.0wnt3:Wnt3EGFP) at 48 hpf before photobleaching. (B) Photobleached region of Wnt3EGFP. (C) Recovery of fluorescence intensity in the bleached region due to diffusion of molecules from the neighboring unbleached regions. (D) Fluorescence recovery curve for Wnt3EGFP with a time constant (τfast) of ~5 min and a mobile component fraction (Fm) of ~0.35. The average apparent global diffusion coefficient (Dglobal) measured for Wnt3EGFP was 0.5 ± 0.2 μm2/s (N = 11). Fluorescence recovery after photobleaching for Wnt3EGFP at a distal target site showed similar recovery dynamics (Figure 5—figure supplement 1) whereas recovery after heparan sulfate proteoglycan disruption showed faster recovery (Figure 5—figure supplement 2). Orientation: anterior to the left. Scale bar 30 μm. |
( |
( |
( |
( |
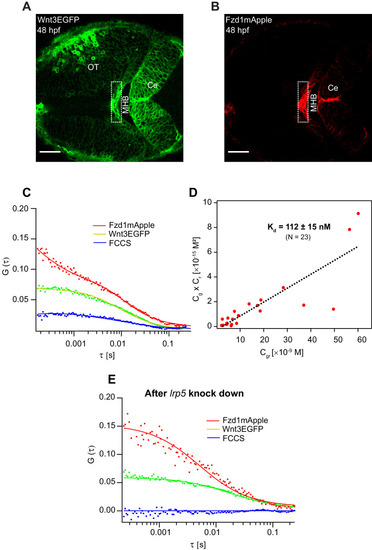
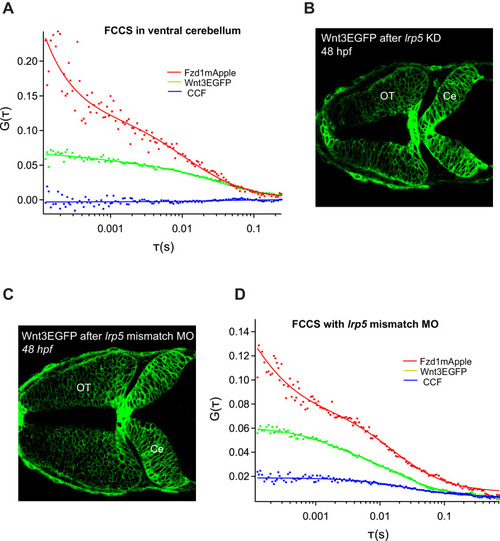
Expression of (A) Wnt3EGFP and (B) Fzd1mApple in the double transgenic [Tg(−4.0wnt3:Wnt3EGFP)×Tg (−4.0wnt3:Fzd1mApple)] (anterior to the left). (C) Representative auto- and cross-correlation functions (dots) and fittings (lines) of a Wnt3EGFP-Fzd1mApple measurement at the indicated region. The cross-correlation function indicates Wnt3EGFP interacts with Fzd1mApple in vivo. (D) Determination of apparent dissociation constant (Kd) for Wnt3-Fzd1 interaction in vivo. Cg, Cr, and Cgr represents the concentration of unbound Wnt3EGFP, unbound Fzd1mApple, and bound Wnt3-Fzd1 molecules respectively. The estimated apparent Kd [Kd = (Cg × Cr)/Cgr] for Wnt3-Fzd1 in vivo is 112 ± 15 nM (N = 23; R2 = 0.85). (E) Representative auto- and cross-correlation functions (dots) and fittings (lines) of a Wnt3EGFP-Fzd1mApple measurement after knocking down lrp5. No cross-correlation indicates Wnt3-Fzd1 interaction is abolished after knockdown of lrp5. Scale bars 30 μm. |
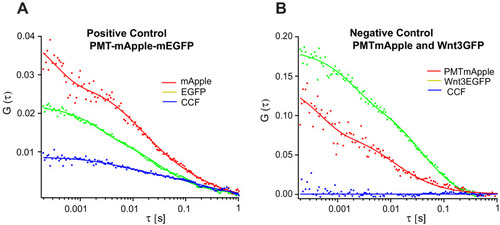
Representative auto- and cross-correlation functions for ( |
( |
( |