
FIGURE
Figure 2
- ID
- ZDB-FIG-201216-10
- Publication
- Veerapathiran et al., 2020 - Wnt3 distribution in the zebrafish brain is determined by expression, diffusion and multiple molecular interactions
- Other Figures
-
- Figure 1.
- Figure 2
- Figure 2—figure supplement 1.
- Figure 2—figure supplement 2.
- Figure 2—figure supplement 3.
- Figure 3
- Figure 3—figure supplement 1.
- Figure 3—figure supplement 2.
- Figure 3—figure supplement 3.
- Figure 4
- Figure 4—figure supplement 1.
- Figure 5
- Figure 5—figure supplement 1.
- Figure 5—figure supplement 2.
- Figure 5—figure supplement 3.
- Figure 5—figure supplement 4.
- Figure 6
- Figure 6—figure supplement 1.
- Figure 6—figure supplement 2.
- Figure 6—figure supplement 3.
- All Figure Page
- Back to All Figure Page
Figure 2
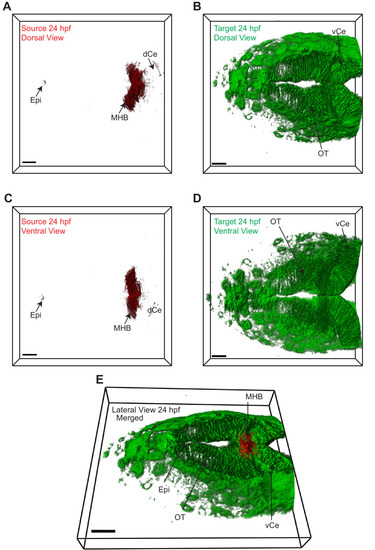
3D dorsal projection of Wnt3 (A) source regions at 24 hpf and (B) target regions at 24 hpf (top view). 3D ventral projection of Wnt3 (C) source regions at 24 hpf and (D) target regions at 24 hpf (bottom view). (E) 3D projection of Wnt3 source and target regions at 24 hpf (lateral view). See Video 3 for a detailed view. dCe, dorsal regions of cerebellum; Epi, epithalamus; MHB, midbrain–hindbrain boundary; OT, optic tectum; vCe, ventral regions of cerebellum. Images orientation: anterior to the left. Scale bar 30 μm. |
Expression Data
Expression Detail
Antibody Labeling
Phenotype Data
Phenotype Detail
Acknowledgments
This image is the copyrighted work of the attributed author or publisher, and
ZFIN has permission only to display this image to its users.
Additional permissions should be obtained from the applicable author or publisher of the image.
Full text @ Elife