
Figure 6
- ID
- ZDB-FIG-201216-24
- Publication
- Veerapathiran et al., 2020 - Wnt3 distribution in the zebrafish brain is determined by expression, diffusion and multiple molecular interactions
- Other Figures
-
- Figure 1.
- Figure 2
- Figure 2—figure supplement 1.
- Figure 2—figure supplement 2.
- Figure 2—figure supplement 3.
- Figure 3
- Figure 3—figure supplement 1.
- Figure 3—figure supplement 2.
- Figure 3—figure supplement 3.
- Figure 4
- Figure 4—figure supplement 1.
- Figure 5
- Figure 5—figure supplement 1.
- Figure 5—figure supplement 2.
- Figure 5—figure supplement 3.
- Figure 5—figure supplement 4.
- Figure 6
- Figure 6—figure supplement 1.
- Figure 6—figure supplement 2.
- Figure 6—figure supplement 3.
- All Figure Page
- Back to All Figure Page
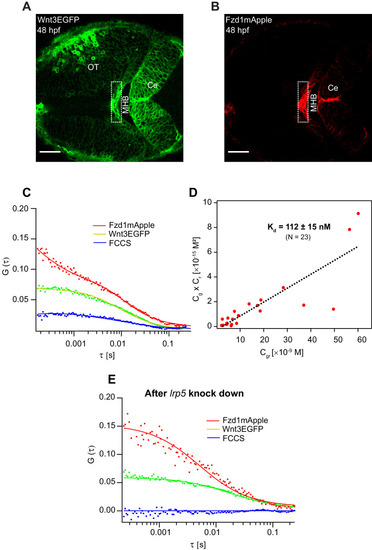
Expression of (A) Wnt3EGFP and (B) Fzd1mApple in the double transgenic [Tg(−4.0wnt3:Wnt3EGFP)×Tg (−4.0wnt3:Fzd1mApple)] (anterior to the left). (C) Representative auto- and cross-correlation functions (dots) and fittings (lines) of a Wnt3EGFP-Fzd1mApple measurement at the indicated region. The cross-correlation function indicates Wnt3EGFP interacts with Fzd1mApple in vivo. (D) Determination of apparent dissociation constant (Kd) for Wnt3-Fzd1 interaction in vivo. Cg, Cr, and Cgr represents the concentration of unbound Wnt3EGFP, unbound Fzd1mApple, and bound Wnt3-Fzd1 molecules respectively. The estimated apparent Kd [Kd = (Cg × Cr)/Cgr] for Wnt3-Fzd1 in vivo is 112 ± 15 nM (N = 23; R2 = 0.85). (E) Representative auto- and cross-correlation functions (dots) and fittings (lines) of a Wnt3EGFP-Fzd1mApple measurement after knocking down lrp5. No cross-correlation indicates Wnt3-Fzd1 interaction is abolished after knockdown of lrp5. Scale bars 30 μm. |