
|
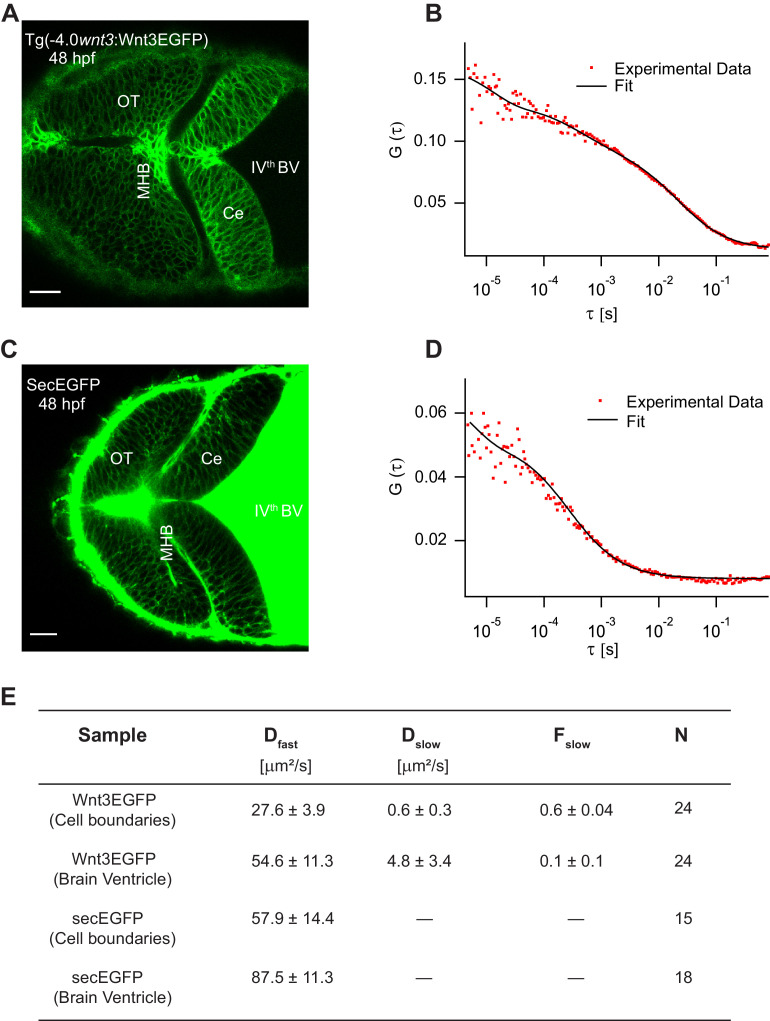
Figure 4 (A) Expression of Wnt3EGFP in Tg(−4.0wnt3:Wnt3EGFP) at 48 hpf. (B) Representative autocorrelation function (ACF; dots) and fitting (line) of a Wnt3EGFP measurement at a cell boundary. (C) Expression of secEGFP in the zebrafish brain at 48 hpf. (D) Representative ACF (dots) and fitting (line) of a secEGFP measurement at a cell boundary. (E) Table showing diffusion coefficients of the fast component (Dfast), slow component (Dslow) and the fraction of slow component (Fslow) for Wnt3EGFP and secEGFP measured by FCS. Measurements were performed in the cell borders of Ce, MHB, and OT; and in the BV. Data are mean ± SD; N = No of measurements. BV, brain ventricle; Ce, cerebellum; MHB, midbrain–hindbrain boundary; OT, optic tectum. Images orientation: anterior to left. Scale bar 30 μm.