
|
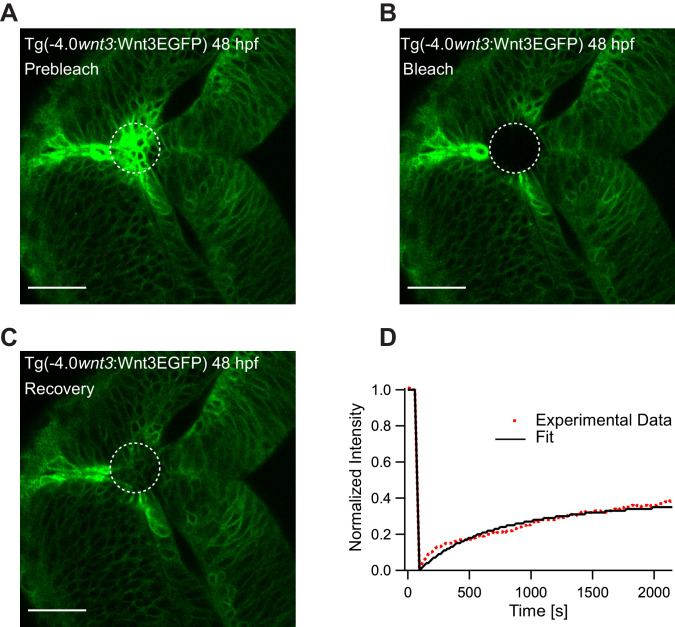
Figure 5 (A) Expression of Wnt3EGFP in Tg(−4.0wnt3:Wnt3EGFP) at 48 hpf before photobleaching. (B) Photobleached region of Wnt3EGFP. (C) Recovery of fluorescence intensity in the bleached region due to diffusion of molecules from the neighboring unbleached regions. (D) Fluorescence recovery curve for Wnt3EGFP with a time constant (τfast) of ~5 min and a mobile component fraction (Fm) of ~0.35. The average apparent global diffusion coefficient (Dglobal) measured for Wnt3EGFP was 0.5 ± 0.2 μm2/s (N = 11). Fluorescence recovery after photobleaching for Wnt3EGFP at a distal target site showed similar recovery dynamics (Figure 5—figure supplement 1) whereas recovery after heparan sulfate proteoglycan disruption showed faster recovery (Figure 5—figure supplement 2). Orientation: anterior to the left. Scale bar 30 μm.