FIGURE SUMMARY
Title

Dynamic regulation of the cholinergic system in the spinal central nervous system

Authors
Rima, M., Lattouf, Y, Abi Younes, M., Bullier, E., Legendre, P., Mangin, J.M., Hong, E.
Source
Full text @ Sci. Rep.

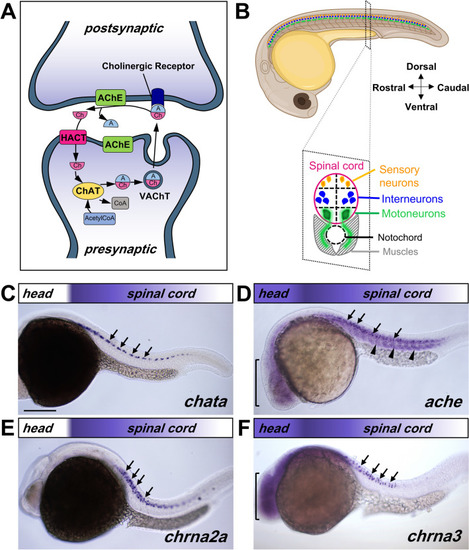
Transcript map of cholinergic genes in the 22–24 hpf embryo. (A) Simplified illustration of ACh signaling between pre- and postsynaptic neurons. Choline Acetyltransferase (ChAT), Vesicular Acetylcholine Transporter (VAChT), Acetylcholinesterase (AChE), High Affinity Choline Transporter (HACT), acetyl (A), Choline (Ch), Acetyl Coenzyme A (AcetylCoA). (B) Schematic representation of embryonic zebrafish spinal cord organization, showing lateral view of a 24 hpf zebrafish embryo (top), and an illustration of transverse section of the spinal cord (bottom). (CF) Lateral view of 22–24 hpf embryos processed by in situ hybridization showing expression for chata (C) in the spinal cord (arrows), ache (D) in the spinal cord (arrows), muscles (arrowheads) and the brain (bracket), chrna2a (E) in the spinal cord (arrows), chrna3 (F) in the spinal cord (arrows) and brain (bracket). The rostro-caudal expression pattern of the transcript is represented by the colored gradient bar on top of each image. Magnification is the same for all images in (CF). Scale bar: 200 μm. Cartoon from (B) was modified from Biorender.

EXPRESSION / LABELING:
Genes:
Fish:
Anatomical Terms:
Stage: 26+ somites

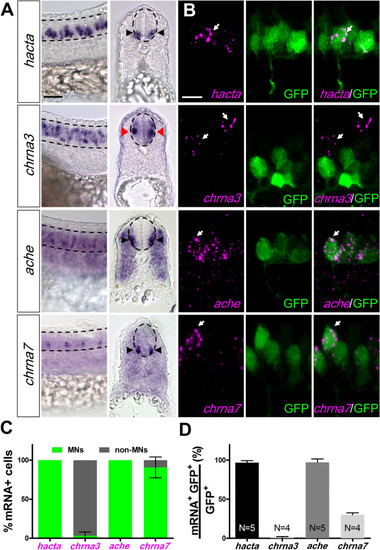
Spatial expression pattern of cholinergic genes in spinal inter- and motoneurons at 24 hpf. (A) Lateral view (left) and cross sections (right) of embryos processed by in situ hybridization showing hacta, chrna3, ache, and chrna7 transcripts in the spinal cord. While hacta, ache, and chrna7 transcripts are expressed in the ventral spinal cord (black arrowheads) that contains motoneurons (MNs), chrna3 is expressed in intermediate spinal cord (red arrowheads) consistent with location of interneurons (INs). The spinal cord is outlined by dashed lines. Scale bar: 30 µm. (B) Representative confocal images of fluorescent in situ hybridization of 24 hpf Tg(mnx1:GFP) embryos showing MNs in green (GFP) and hacta (first row), chrna3 (second row), ache (third row), and chrna7 (fourth row) transcript in magenta (white arrows). Scale bar: 15 µm. (C) Classification of hacta, chrna3, ache, and chrna7 expression in MNs (green) or non-MNs (grey). (D) Percentage of hacta, chrna3, ache, and chrna7 expressing mnx1:GFP neurons. hacta: N = 5 embryos (176 mnx1:GFP+ neurons, 171 hacta+ neurons). chrna3: N = 4 embryos (214 mnx1:GFP+ neurons, 77 chrna3+ neurons). ache: N = 5 (132 mnx1:GFP+ neurons, 128 ache+ neurons). chrna7: N = 8 embryos (223 mnx1:GFP+ neurons, 59 chrna7+ neurons).

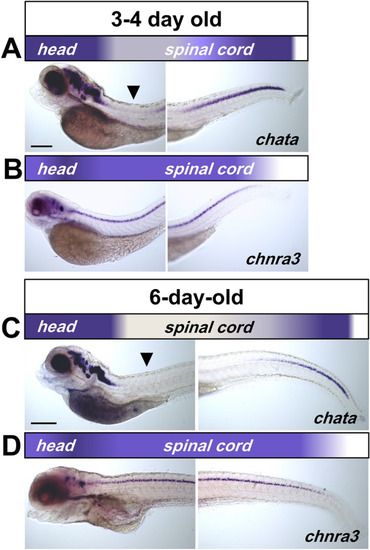
Downregulation of presynaptic cholinergic gene transcript in larval spinal cord. (A, C) Lateral view of 3–4 and 6-day-old larvae processed by in situ hybridization showing a rostro-caudal gradient for chata. Arrowheads point toward reduced transcript levels in rostral spinal cord. (B, D) chrna3 remain expressed in a uniform pattern along the entire spinal cord. The rostro-caudal expression pattern of the transcript is represented by the colored gradient bar on top of each image. Note that there is no change in transcript levels in the brain. Magnification is the same for all images in (AD). Scale bar: 200 μm.

EXPRESSION / LABELING:
Genes:
Fish:
Anatomical Terms:
Stage Range: Protruding-mouth to Day 6

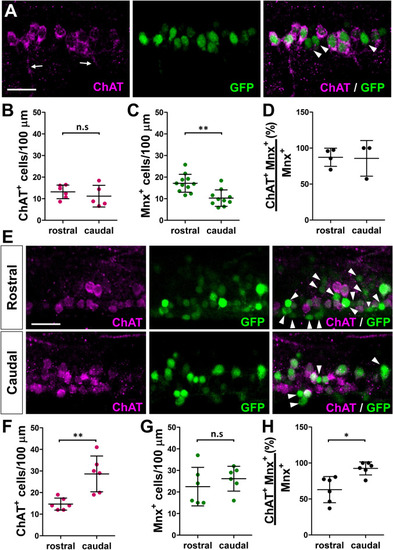
Expression of ChAT in Tg(mnx1:GFP) spinal motoneurons. (A) Confocal images of a lateral view of 24 hpf embryos processed with antibody labeling showing ChAT in MN soma and axons (arrows). Arrowheads point to ChAT-mnx1:GFP+ cells. (BD) Quantification of ChAT and mnx1:GFP labeled cells in 24 hpf Tg(mnx1:GFP) embryos. (B) ChAT+ and (C) mnx1:GFP labeled cell numbers in 100 μm segment in rostral and caudal spinal cord of 24 hpf embryos. (N = 10 embryos; 527 mnx1:GFP+ neurons, 307 ChAT+ neurons). (D) Percentage of ChAT expressing mnx1:GFP neurons in rostral and caudal spinal cord. (N = 7 embryos; 186 mnx1:GFP+ neurons, 172 ChAT+ neurons). (E) Confocal images of a lateral view of a 6-day-old larva processed with antibody labeling showing that ChAT-mnx1:GFP+ cells (arrowheads) are found more in the rostral than caudal spinal cord. (F–H) Quantification of ChAT and mnx1:GFP labeled cells in 6-day-old Tg(mnx1:GFP) larvae. (F) ChAT+ and (G) mnx1:GFP labeled cell numbers in 100 μm segment in the rostral and caudal spinal cord of 6-day-old Tg(mnx1:GFP) larvae. (H) Percentage of ChAT expressing mnx1:GFP neurons in rostral and caudal spinal cord. (N = 6 larvae; 499 mnx1:GFP+ neurons, 381 ChAT+ neurons). All images are oriented with rostral towards the left and dorsal to the top. Scale bar: 20 μm. 2-tailed non-paired Student’s t test; n.s.: not significant; *p < 0.05; **p < 0.005.

EXPRESSION / LABELING:
Gene:
Fish:
Anatomical Term:
Stage Range: Prim-5 to Day 6

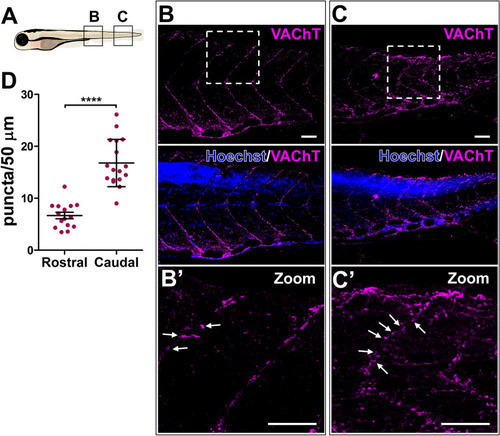
Decreased VAChT expression along the rostral myosepta of 6-day-old larva. (A) Schematic representation of the imaged areas in (B, C). (B, C) Confocal image of a lateral view of larva showing a rostro-caudal gradient of VAChT puncta in MN axons projecting along the dorsal myosepta. Nuclei are labeled by Hoechst (blue). (B′, C′) Zoomed in images of the boxed areas in (B, C). White arrows point toward VAChT positive signals along the myosepta. Scale bars: 50 μm. (D) Quantification of VAChT puncta in the dorsal myosepta. N = 4 larvae (15 rostral axons, 17 caudal axons). 2-tailed non-paired Student’s t test; ****p < 0.0001.

EXPRESSION / LABELING:
Antibody:
Fish:
Anatomical Term:
Stage: Day 6

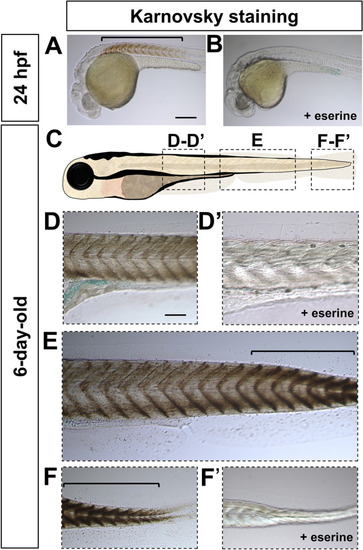
Spatiotemporal Acetylcholinesterase enzymatic activity pattern in the spinal cord during early development. (A, B) Lateral view of 24 hpf embryos processed with Karnovsky staining showing Acetylcholinesterase enzymatic activity (bracket) in the absence (A), but not in presence (B) of eserine, an AChE inhibitor. (C) Schematic representation of the imaged areas in (DF′). Lateral view of 6-day-old larvae showing a rostro-caudal gradient of AChE activity revealed by Karnovsky staining (DF′). (D, D′) Anterior trunk in the absence (D) or presence (D′) of eserine. (E) Mid trunk in the absence of eserine. (F, F′) Tip of the tail in the absence (F) or presence (F′) of eserine. Brackets indicate high levels of Karnovsky staining in (E, F). Magnification is the same for all images in (A, B) and (DF′). Scale bar: 200 μm.

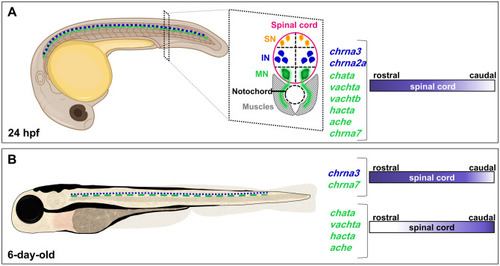
Spatiotemporal cholinergic gene map in embryonic and larval zebrafish. (A, B) Illustration of 24 hpf embryo (A) and 6-day-old larva (B) summarizing the cholinergic genes expressed in spinal motoneurons (green) and interneurons (blue). The rostro-caudal expression pattern of the transcripts is represented by the colored gradients on the right. Abbreviations:  sensory neurons (SN), interneurons (IN), motoneurons (MN).

ZFIN is incorporating published figure images and captions as part of an ongoing project. Figures from some publications have not yet been curated, or are not available for display because of copyright restrictions.

ZFIN is incorporating published figure images and captions as part of an ongoing project. Figures from some publications have not yet been curated, or are not available for display because of copyright restrictions.

EXPRESSION / LABELING:
Gene:
Fish:
Anatomical Term:
Stage: Prim-5

ZFIN is incorporating published figure images and captions as part of an ongoing project. Figures from some publications have not yet been curated, or are not available for display because of copyright restrictions.

ZFIN is incorporating published figure images and captions as part of an ongoing project. Figures from some publications have not yet been curated, or are not available for display because of copyright restrictions.

EXPRESSION / LABELING:
Genes:
Fish:
Anatomical Terms:
Stage: Protruding-mouth

ZFIN is incorporating published figure images and captions as part of an ongoing project. Figures from some publications have not yet been curated, or are not available for display because of copyright restrictions.

EXPRESSION / LABELING:
Genes:
Fish:
Anatomical Terms:
Stage: Day 6

ZFIN is incorporating published figure images and captions as part of an ongoing project. Figures from some publications have not yet been curated, or are not available for display because of copyright restrictions.

EXPRESSION / LABELING:
Gene:
Fish:
Anatomical Terms:
Stage Range: Days 7-13 to Days 14-20
Acknowledgments
This image is the copyrighted work of the attributed author or publisher, and ZFIN has permission only to display this image to its users. Additional permissions should be obtained from the applicable author or publisher of the image. Full text @ Sci. Rep.