
Figure 5
- ID
- ZDB-IMAGE-201003-74
- Antibodies
- Publication
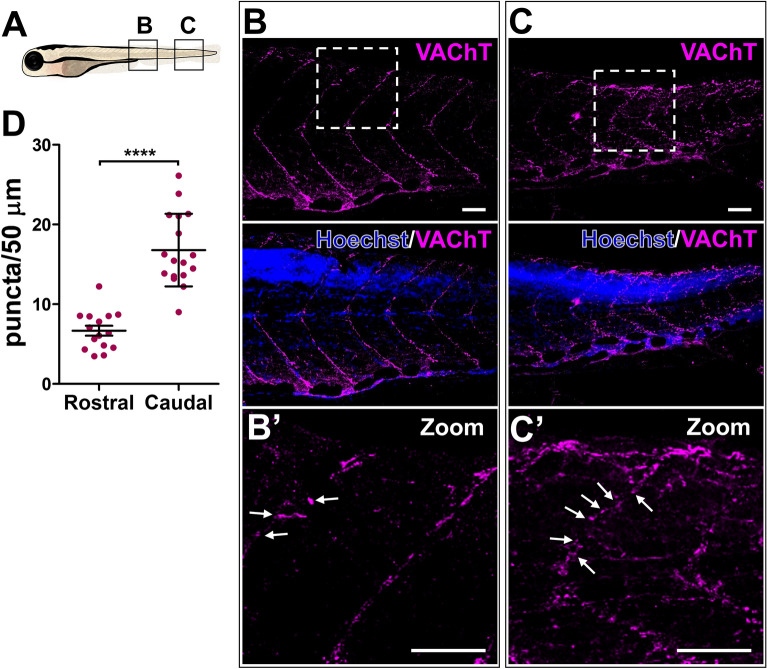
- Rima et al., 2020 - Dynamic regulation of the cholinergic system in the spinal central nervous system
- All Figures
- Figures for Rima et al., 2020
|
Figure 5
Decreased VAChT expression along the rostral myosepta of 6-day-old larva. (