FIGURE

Figure 1

ID
ZDB-FIG-201003-67
Publication
Rima et al., 2020 - Dynamic regulation of the cholinergic system in the spinal central nervous system
Other Figures
All Figure Page
Back to All Figure Page
Figure 1

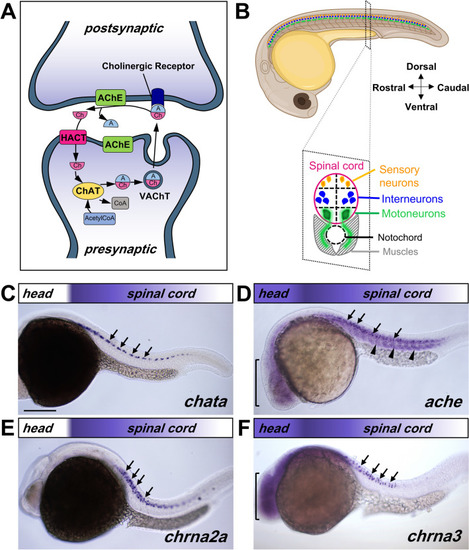
Transcript map of cholinergic genes in the 22–24 hpf embryo. (A) Simplified illustration of ACh signaling between pre- and postsynaptic neurons. Choline Acetyltransferase (ChAT), Vesicular Acetylcholine Transporter (VAChT), Acetylcholinesterase (AChE), High Affinity Choline Transporter (HACT), acetyl (A), Choline (Ch), Acetyl Coenzyme A (AcetylCoA). (B) Schematic representation of embryonic zebrafish spinal cord organization, showing lateral view of a 24 hpf zebrafish embryo (top), and an illustration of transverse section of the spinal cord (bottom). (CF) Lateral view of 22–24 hpf embryos processed by in situ hybridization showing expression for chata (C) in the spinal cord (arrows), ache (D) in the spinal cord (arrows), muscles (arrowheads) and the brain (bracket), chrna2a (E) in the spinal cord (arrows), chrna3 (F) in the spinal cord (arrows) and brain (bracket). The rostro-caudal expression pattern of the transcript is represented by the colored gradient bar on top of each image. Magnification is the same for all images in (CF). Scale bar: 200 μm. Cartoon from (B) was modified from Biorender.

Expression Data
Genes:
Fish:
Anatomical Terms:
Stage: 26+ somites

Expression Detail
Antibody Labeling
Phenotype Data

Phenotype Detail
Acknowledgments
This image is the copyrighted work of the attributed author or publisher, and ZFIN has permission only to display this image to its users. Additional permissions should be obtained from the applicable author or publisher of the image. Full text @ Sci. Rep.