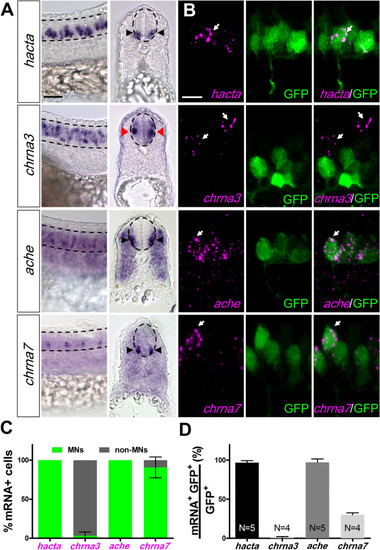
Spatial expression pattern of cholinergic genes in spinal inter- and motoneurons at 24 hpf. (A) Lateral view (left) and cross sections (right) of embryos processed by in situ hybridization showing hacta, chrna3, ache, and chrna7 transcripts in the spinal cord. While hacta, ache, and chrna7 transcripts are expressed in the ventral spinal cord (black arrowheads) that contains motoneurons (MNs), chrna3 is expressed in intermediate spinal cord (red arrowheads) consistent with location of interneurons (INs). The spinal cord is outlined by dashed lines. Scale bar: 30 µm. (B) Representative confocal images of fluorescent in situ hybridization of 24 hpf Tg(mnx1:GFP) embryos showing MNs in green (GFP) and hacta (first row), chrna3 (second row), ache (third row), and chrna7 (fourth row) transcript in magenta (white arrows). Scale bar: 15 µm. (C) Classification of hacta, chrna3, ache, and chrna7 expression in MNs (green) or non-MNs (grey). (D) Percentage of hacta, chrna3, ache, and chrna7 expressing mnx1:GFP neurons. hacta: N = 5 embryos (176 mnx1:GFP+ neurons, 171 hacta+ neurons). chrna3: N = 4 embryos (214 mnx1:GFP+ neurons, 77 chrna3+ neurons). ache: N = 5 (132 mnx1:GFP+ neurons, 128 ache+ neurons). chrna7: N = 8 embryos (223 mnx1:GFP+ neurons, 59 chrna7+ neurons).
|
