
Figure 1
- ID
- ZDB-IMAGE-201003-70
- Genes
- Publication
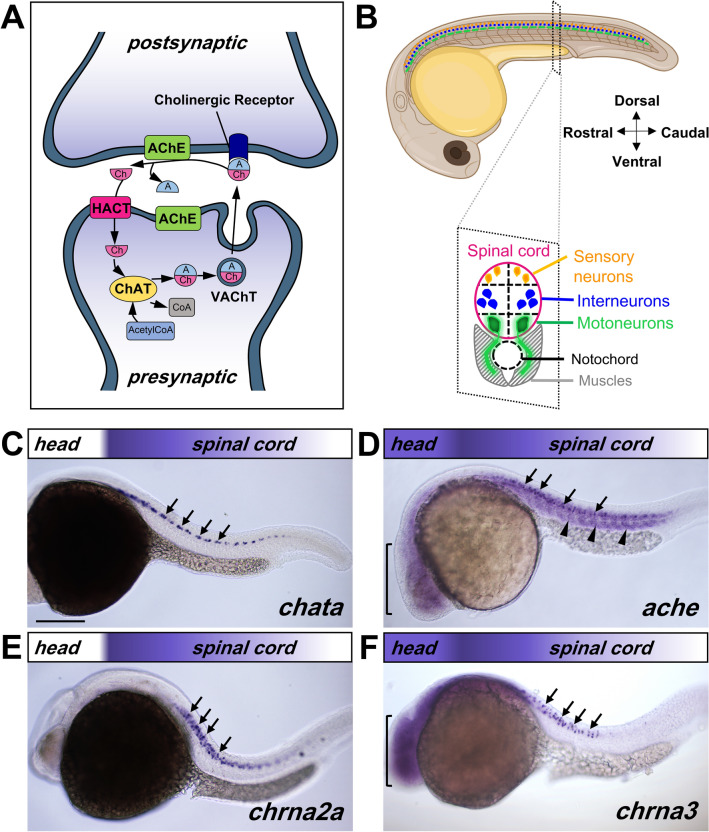
- Rima et al., 2020 - Dynamic regulation of the cholinergic system in the spinal central nervous system
- All Figures
- Figures for Rima et al., 2020
|
Figure 1
Transcript map of cholinergic genes in the 22–24 hpf embryo. (