IMAGE

Figure 4

ID
ZDB-IMAGE-201003-73
Genes
Source
Figures for Rima et al., 2020
Image
Figure Caption

Figure 4

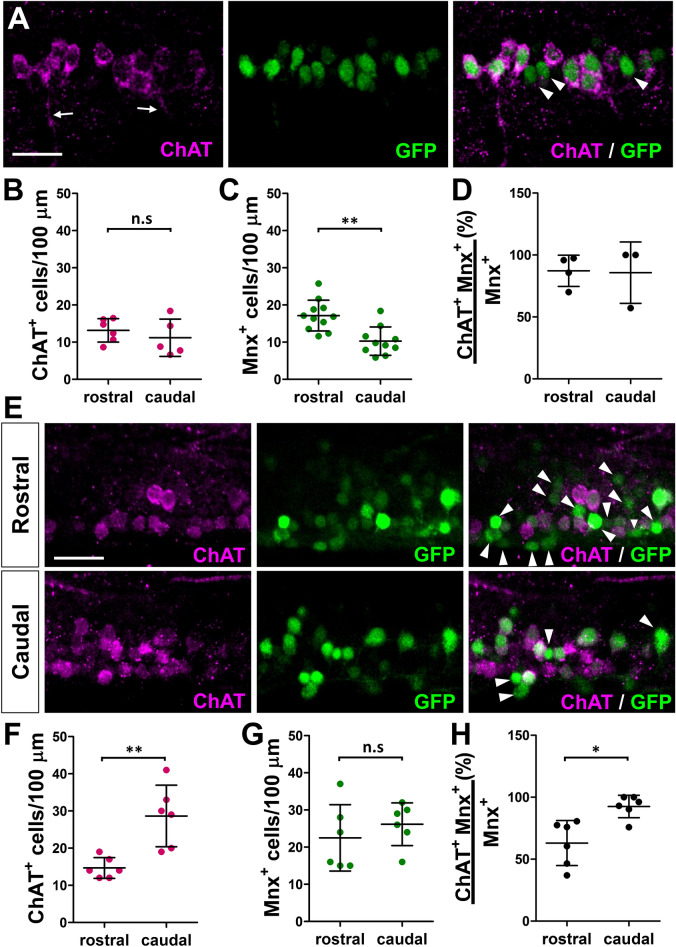
Expression of ChAT in Tg(mnx1:GFP) spinal motoneurons. (A) Confocal images of a lateral view of 24 hpf embryos processed with antibody labeling showing ChAT in MN soma and axons (arrows). Arrowheads point to ChAT-mnx1:GFP+ cells. (BD) Quantification of ChAT and mnx1:GFP labeled cells in 24 hpf Tg(mnx1:GFP) embryos. (B) ChAT+ and (C) mnx1:GFP labeled cell numbers in 100 μm segment in rostral and caudal spinal cord of 24 hpf embryos. (N = 10 embryos; 527 mnx1:GFP+ neurons, 307 ChAT+ neurons). (D) Percentage of ChAT expressing mnx1:GFP neurons in rostral and caudal spinal cord. (N = 7 embryos; 186 mnx1:GFP+ neurons, 172 ChAT+ neurons). (E) Confocal images of a lateral view of a 6-day-old larva processed with antibody labeling showing that ChAT-mnx1:GFP+ cells (arrowheads) are found more in the rostral than caudal spinal cord. (F–H) Quantification of ChAT and mnx1:GFP labeled cells in 6-day-old Tg(mnx1:GFP) larvae. (F) ChAT+ and (G) mnx1:GFP labeled cell numbers in 100 μm segment in the rostral and caudal spinal cord of 6-day-old Tg(mnx1:GFP) larvae. (H) Percentage of ChAT expressing mnx1:GFP neurons in rostral and caudal spinal cord. (N = 6 larvae; 499 mnx1:GFP+ neurons, 381 ChAT+ neurons). All images are oriented with rostral towards the left and dorsal to the top. Scale bar: 20 μm. 2-tailed non-paired Student’s t test; n.s.: not significant; *p < 0.05; **p < 0.005.

Figure Data
Acknowledgments
This image is the copyrighted work of the attributed author or publisher, and ZFIN has permission only to display this image to its users. Additional permissions should be obtained from the applicable author or publisher of the image. Full text @ Sci. Rep.