- Title
-
Cdon promotes neural crest migration by regulating N-cadherin localization
- Authors
- Powell, D.R., Williams, J.S., Hernandez-Lagunas, L., Salcedo, E., O'Brien, J.H., Bruk Artinger, K.
- Source
- Full text @ Dev. Biol.
|
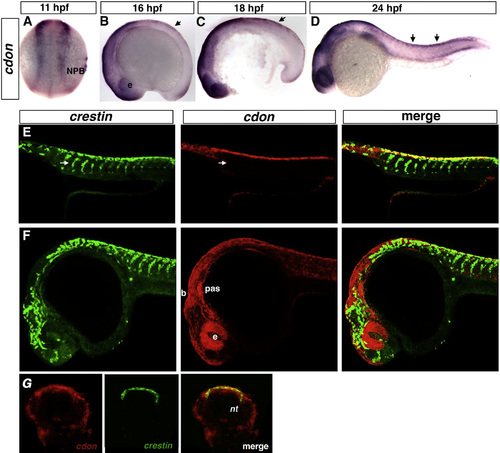
cdon is expressed in the NPB and premigratory trunk NCCs. Dorsal view and anterior to the top (A), and lateral views, anterior to the left (B)–(F). ISH of 11, 16, 18, and 24 hpf stage wildtype embryos. (A)–(D) cdon is expressed in the neural plate border (NPB) and dorsal neural tube (arrows). (E) and (F) Lateral view confocal single optical plane micrograph of double fluorescent ISH of 24 hpf wildtype embryos for crestin (green) and cdon (red). cdon is expressed in premigratory NCCs in the trunk (yellow) but not in the migratory streams (arrows, E) and widely expressed in cranial region including the brain, eye, and pharyngeal arches (F). 14 µm cryosections of double FISH embryos suggests that cdon and crestin colocalize in the dorsal neural tube/neural crest staging area in the trunk (G). b, brain; e, eye; NPB, neural plate border; NT, neural tube; pas, pharyngeal arches. |
|
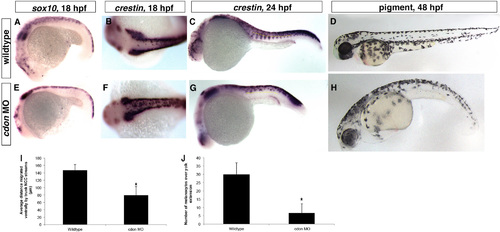
cdon is required for trunk neural crest migration. Lateral views, anterior to the left except (B) and (F) which is a dorsal view with anterior to the left. (A)–(C), (E)–(G) ISH for neural crest markers sox10 at 18 somites and crestin at 18 and 24 hpf in wildtype and cdon morphant embryos. (A)–(C) In wildtype embryos, NCCs migrate in streams ventrally from the neural tube, while (E)–(G) cdon morphant NCCs do not migrate far ventrally and appear to stall after migrating a short distance (distance migrated at 24 hpf by the most ventral NCC in each of the first 7 migratory streams over the yolk extension; wildtype average=146.9 µm, cdon MO average=79.7 µm; p=0.000009). In addition more NCCs are localized along the dorsal midline, suggesting a migratory defect (compared B to F; sox10: wildtype, n=40/41 normal migration where NCC streams migrate ventral to midline in at least 5 out of the first 7 streams above the yolk extension(y.e.); cdon MO, n=33/39 with impaired migration; crestin: wildtype n=62/64 normal migration, cdon MO, n=21/25). (D) and (H) Imaging of melanocytes at 48 hpf displays a loss of ventral melanocytes in cdon morphants (average of 6.7 over yolk extension) compared to wildtype (average 30 over y.e., p=0.012), suggesting NCCs do not reach ventral positions. (I) and (J) Quantification of C, G and D, H. |
|
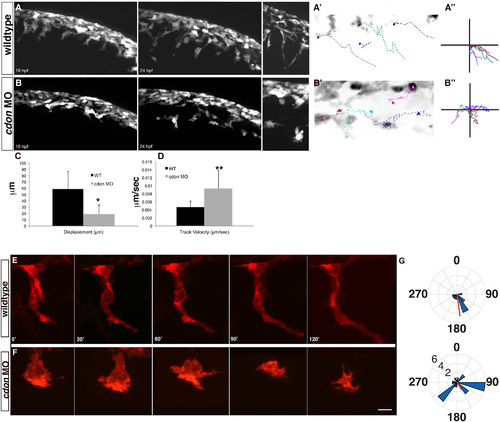
The directedness of migration and cell protrusions is disrupted following cdon knockdown. Live imaging of wildtype (A) and cdon morphant (B) sox10:eGFP embryos from 19–24 hpf shows failure of directed NCC migration in cdon morphants. A high-resolution image of migrating NCCs (at approximately 22 hpf) in wildtype and cdon morphants (insets to the right) displays abnormal cellular morphology and protrusions in cdon morphant embryos. (A′) and (B′) Inverse images of migrating tracks in both wildtype (A′) and morphant embryos (B′) displays a lack of directed migration along the anterior–posterior axis in cdon morphant embryos (n=6 cells for each), cells are in black and colored dashed lines represent a trace of each individual cell over the time period. (A′′) and (B′′) A plot of traces of same cells in (A′) and (B′) to illustrate the anterior–posterior movement and loss of directed migration in cdon morphant NCCs as compared to wildtype cells. (C) and (D) Quantification of Displacement index (C) and Velocity (D) using Volocity Software (PerkinElmer) suggests increased motility and decreased directedness in cdon morphant NCCs. Displacement is a measure of straight-line distance from the first position to the last position with a higher number indicative more distance between the first and last point. For wildtype cells (n=6) the displacement index was 58.9±28.27 µm and in cdon MO (n=17) 18.68±14.45 µm; p=0.01. For velocity measurements, wildtype cells (n=6) were tracked at 0.0046±0.0015 µm/s whereas cdon MO cells (n=17) tracked at 0.00931±0.0046 µm/s; p=0.001. (E)–(G) Wildtype and cdon morphant NCC imaged in Tg(sox10:memRFP) over 120 min to determine the direction and number of cellular protrusions. (E) Wildtype cells have highly directed and stable protrusions (F). In the cdon morphant cells, the number and distribution of the protrusions is significantly increased as compared to wildtype cells (mean±sem=4.4±0.81 vs 2.0±0.25, respectively; unpaired T-test, p=0.0138), which gives the cells a more rounded appearance. (G) Rose plots show the distribution around a circle with 0° dorsal and 180° ventral. A circular T-test to quantify the directionality of the protrusions suggests that the wildtype cells are more directional then the cdon morphant NCCs and significantly departs from uniformity (length of red line, p<0.001) but the overall directionality (position of red line) is significantly different in the wildtype using the Rayleigh test of uniformity (p=1.21×10⁸) and trending towards significance in the cdon morphant NCCs (p=0.021). Numbers in G are position around a circle from 0–360 and length of wedge indicates the number of protrusions (2, 4, 6) of a given cell. |
|
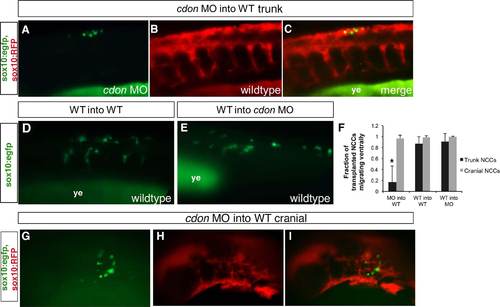
cdon is required cell-autonomously for NCC migration. Lateral views of live transplanted embryos, anterior to the left. Both transplanted donor cells sox10:eGFP and wildtype sox10:RFP host NCCs are visualized in the same embryo. (A)–(C) Presumptive NCCs from cdon morphant sox10:eGFP embryos were transplanted into the presumptive neural plate border region of 4 hpf wildtype sox10:RFP host embryos and imaged at 30 hpf. Donor cells from cdon morphants (green) were unable to migrate in wildtype host background (red), suggesting that cdon is required cell autonomously for NCC migration. (B) WT into WT and (E) WT into cdon MO transplants were performed as controls (showing only transplanted cells in green). Transplanted donor wildtype NCCs in either a wildtype or cdon MO background migrate normally. The sox10:RFP expression in these embryos was too weak to visualize in live embryos as shown. (F) Quantification of the fraction of cells transplanted as compared to the total number migrating in all conditions. For the calculations, at least 5 embryos were used for quantification: cdon MO into wildtype, 34 trunk NCCs transplanted in 11 embryos, only 5 cells migrated ventrally beyond the dorsal neural tube, indicating that only 16.5% were able to migrate in a wildtype environment as compared to 97% of cdon morphant cranial NCCs (155 cells transplanted in 13 embryos). For WT into WT transplants, 28 transplanted trunk cells in 6 embryos and 72 cranial cells in 5 embryos migrated ventrally. For WT into MO, 30 transplanted trunk cells in 6 embryos and 108 cranial cells in 5 embryos. WT, wildtype uninjected embryo; p<0.05. (G)–(I) Donor cells from cdon morphants (green) were able to migrate in wildtype host background (red) in the cranial region, suggesting that cdon is required cell autonomously for trunk NCC migration but not cranial NCC migration. |
|
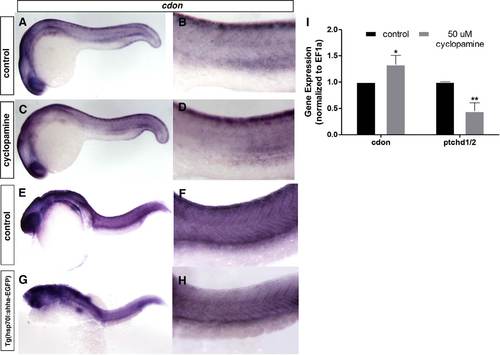
cdonmRNA expression is regulated by Shh. cdon expression is slightly but significantly upregulated in the dorsal neural tube following Shh inhibition with cyclopamine as compared to control shown by ISH (A)–(D). Overexpression of Shh via heat shock results in loss of cdon expression. tg(hsp70l:shha-eGFP) embryos were heat shocked at 10 hpf and ISH was performed at 28 hpf for cdon expression. cdon is decreased within the dorsal trunk of Shh overexpressing embryos at 28 hpf (E–H; n=38 for heat shock; n=20 no heat shock). (I) qRT-PCR for cdon and patched 1/2 following Cyclopamine treatment show significant upregulation (p=0.0294) of cdon following Shh inhibition. Positive controls for Shh knockdown include patched1/2, a downstream readout of the canonical Shh signaling pathway, which is significantly reduced following cyclopamine treatment (p=0.0039). Gene expression was normalized to EF1a. Unpaired two tailed T-tests were performed in Graphpad (Prism). |
|
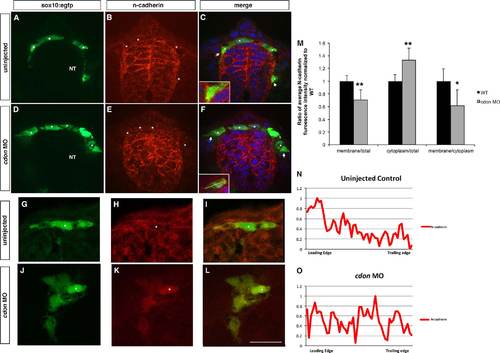
N-cadherin is mislocalized in cdon morphant NCCs. Confocal images of cross-sectional immunofluorescent staining (12 µm sections, 1 µm optical sections) of the neural tube show N-cadherin localized to the cell surface of sox10:GFP-positive NCCs at 24 hpf (DAPI in blue, N-cadherin in red, sox10:GFP in green). (A)–(C) In wildtype embryos, N-cadherin is localized to the cell membrane leading edge, (D)–(F) while in cdon morphant NCCs, N-cadherin is evenly distributed in the cytoplasm. Insets in (C) and (F) show higher magnification of the triple labeled NCCs. (G)–(L) High magnification (63×) of a different group of neural crest cells in uninjected (G)–(I) and cdon MO injected (J)–(L) clearly demonstrating membrane localization in control neural crest cells while cdon knockdown cells have N-cadherin distributed evenly across the cell. (M)–(O) Fluorescent intensity of N-cadherin expression at the plasma membrane and cytoplasm was measured in ImageJ. Using plot profile, the midpoint of the cell was determined, and a line drawn through the center of the cell using the sox10-egfp positive cytoplasm to gate the membrane (ie at the edge of the gfp), shown as yellow line in inset, normalized from 0–1. From the line scan of fluorescence intensity, a line was then drawn down the center of the cell and ratios of membrane to total, cytoplasm to total, and membrane to cytoplasm were calculated for wildtype and cdon morphant NCCs; *p<0.05, **p<0.01. (N) and (O) Fluorescent intensity plot profile traces of migrating NCCs with ImageJ (NIH). In control cells, N-cadherin is expressed on the cell membrane and primarily on the leading edge membrane (n=13/16) while cdon MO cells show an even distribution across the cells (n=7/14) or a graded distribution (n=7/14) but without correlation to leading verses trailing edges. NT, neural tube; *’s denote migratory NCCs, along with arrows labeling the leading edge of most ventral migrating cells. Scale bar is 12 µm in L. |
|
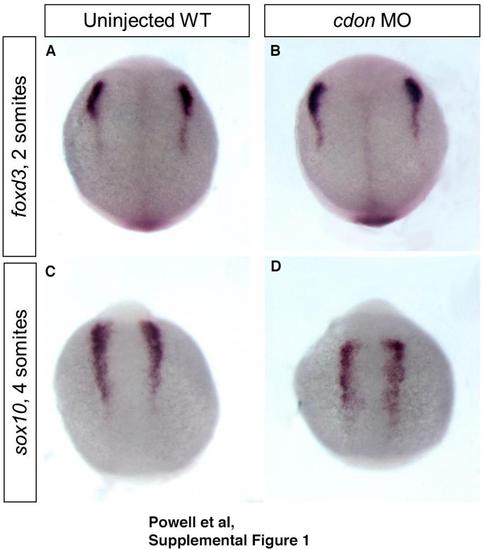
cdonis dispensable for neural crest specification. ISH for neural crest specification markers (A, B) foxd3 and (C, D) sox10 at 11 hpf (2 somites) and 13 hpf (4 somites) shows no change in expression between wildtype and cdon morphants, demonstrating that cdon does not regulate neural crest specification. n=37/38 for foxd3 and 47/48 for sox10. |
|
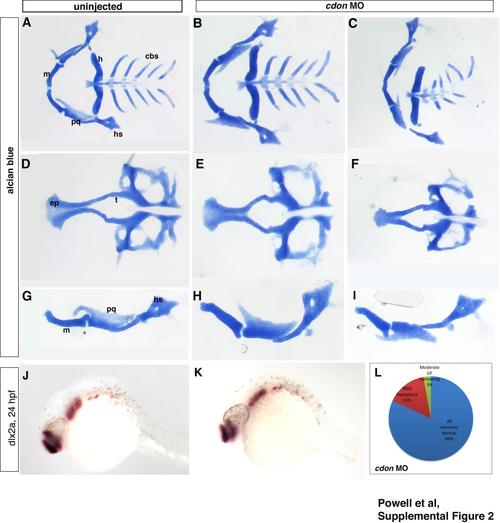
cdonis not required for cranial neural crest migration and cartilage development. (A)–(I) Alcian blue staining of cartilage at 5 dpf shows normal formation of cartilage in uninjected wildtype and cdon morphant embryos. (B), (E), and (H) In a small percentage of cdon morphants, mild hypoplasia was observed as well as (C), (F), and (I) moderate ethmoid plate narrowing. (J), and (K) dlx2a expression, a marker of pharyngeal arch NCCs at 24 hpf is also not affected by cdon knockdown. (L) Embryos were classified by phenotype as exhibiting either normal formation, mild hypoplasia, or narrowing of the ethmoid plate. cdon morphants are mostly normal with a small percentage displaying some mild craniofacial defects. |
|
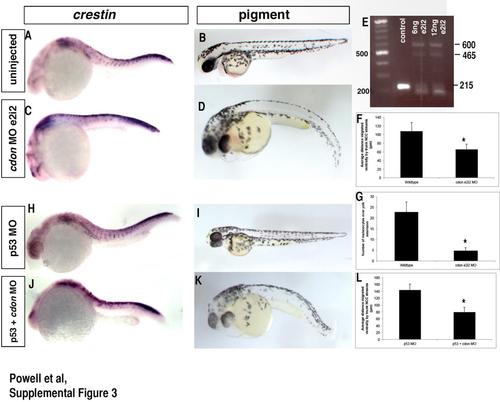
cdonmorpholinos act specifically to knockdowncdon. (A), (C), (H), and (J) ISH for neural crest marker crestin and (B), (D), (I), and (K) melanocyte formation following cdon knockdown with splice blocking MO E2I2, or co-injected with p53 MO. In both, crestin expression and melanocyte formation is affected and is similar to the ATG MO shown in Fig. 2. Distance migrated by e2i2 morphant NCCs of the first 7 somites over the yolk extension averaged 65.5 µm compared to 108 µm in wildtype, *p<0.0001, quantification in F; number of melanocytes over yolk extension=4.8 in e2i2 MO vs 22.8 in wildtype controls, *p=0.006, quantification in G. p53 MO was unable to rescue migration of cdon ATG MO NCCs (average distance migrated in p53+cdon MO=79.4 µm compared to 143.7 µm in p53 MO alone, p<0.0001, quantification in L.) (E) RT-PCR for splicing of cdon following injection of 6 or 12 ng of cdon MO shows multiple sized bands representing mis-splicing of cdon RNA. Wildtype band exhibiting normal splicing is amplified at 215 bp while mis-splicing and subsequent inclusion of intron 2 results in a band shift to 465–600 bp. |
|
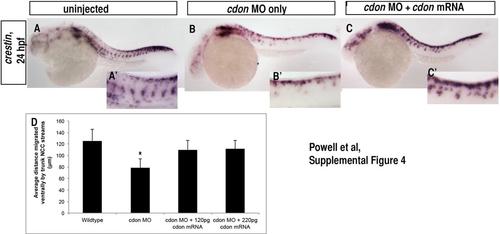
cdonmRNA can rescue the cdon morphant phenotype. (A)–(C) Rescue of crestin expression at 24 hpf following cdon mRNA and MO co-injection. While injection of cdon ATG MO alone resulted in aberrant NCC migration (Fig. 2), co-injection with 120–220 pg of cdon mRNA resulted in the development of a greater number of embryos that had migratory streams and do not display the cdon morphant phenotype (n=12/119 or 10% compared to 84% morphant phenotype observed in MO injected alone.) (A′)–(C′) Higher magnification of NCC migratory streams in all conditions. The partial rescue of the cdon morphant phenotype by co-injection with cdon mRNA suggests that the cdon ATG MO specifically targets cdon. (D) Quantification of the average distance migrated by NCCs: wildtype=125.4 µm, cdon MO=78.8 µm, cdon MO+120 pg cdon mRNA=110 µm, cdon MO+220 pg cdon mRNA=111.5 µm;* p<0.0001 by ANOVA. |
|
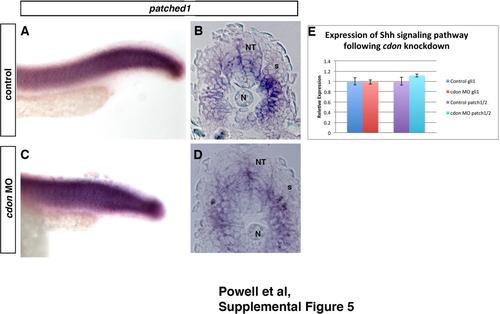
Knockdown ofcdondoes not affectpatchedorgliexpression. (A)–(E) patched1/2 and gli1 expression following cdon knockdown. (F)–(I) ISH of cdon MO with patched1 in whole mount and 12 µm sections shows no change in patched1 expression. (J) Similarly, qRT-PCR for both patched1/2 and gli1 also shows no change in expression. Statistics were performed with a Students T-test, error bars are standard error of the mean (sem). |
Reprinted from Developmental Biology, 407(2), Powell, D.R., Williams, J.S., Hernandez-Lagunas, L., Salcedo, E., O'Brien, J.H., Bruk Artinger, K., Cdon promotes neural crest migration by regulating N-cadherin localization, 289-99, Copyright (2015) with permission from Elsevier. Full text @ Dev. Biol.

