Fig. S3
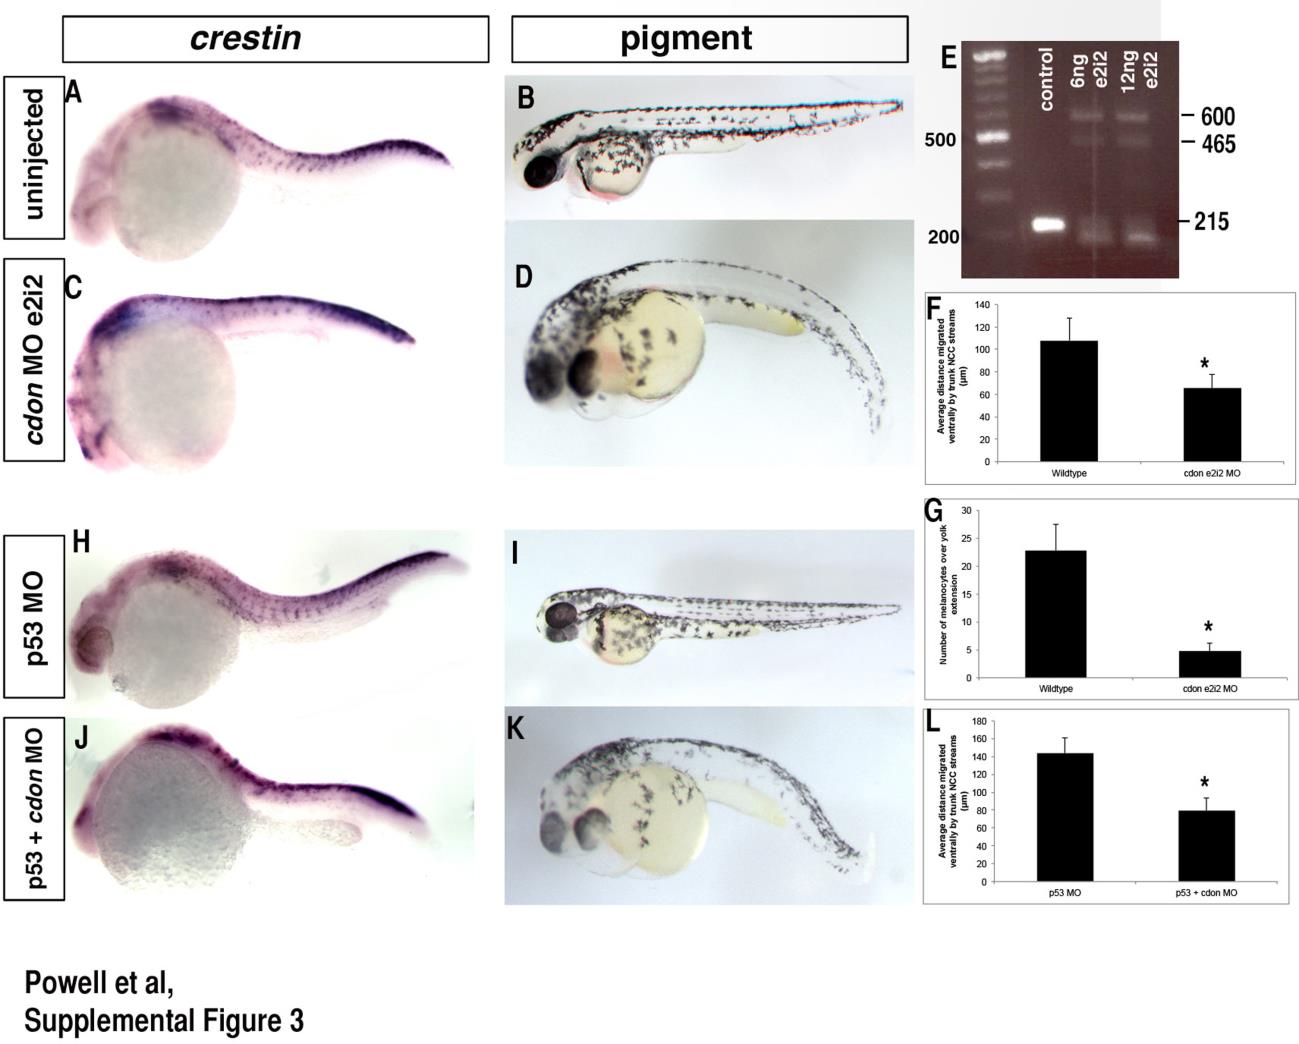
cdonmorpholinos act specifically to knockdowncdon. (A), (C), (H), and (J) ISH for neural crest marker crestin and (B), (D), (I), and (K) melanocyte formation following cdon knockdown with splice blocking MO E2I2, or co-injected with p53 MO. In both, crestin expression and melanocyte formation is affected and is similar to the ATG MO shown in Fig. 2. Distance migrated by e2i2 morphant NCCs of the first 7 somites over the yolk extension averaged 65.5 µm compared to 108 µm in wildtype, *p<0.0001, quantification in F; number of melanocytes over yolk extension=4.8 in e2i2 MO vs 22.8 in wildtype controls, *p=0.006, quantification in G. p53 MO was unable to rescue migration of cdon ATG MO NCCs (average distance migrated in p53+cdon MO=79.4 µm compared to 143.7 µm in p53 MO alone, p<0.0001, quantification in L.) (E) RT-PCR for splicing of cdon following injection of 6 or 12 ng of cdon MO shows multiple sized bands representing mis-splicing of cdon RNA. Wildtype band exhibiting normal splicing is amplified at 215 bp while mis-splicing and subsequent inclusion of intron 2 results in a band shift to 465–600 bp.
Reprinted from Developmental Biology, 407(2), Powell, D.R., Williams, J.S., Hernandez-Lagunas, L., Salcedo, E., O'Brien, J.H., Bruk Artinger, K., Cdon promotes neural crest migration by regulating N-cadherin localization, 289-99, Copyright (2015) with permission from Elsevier. Full text @ Dev. Biol.

