
|
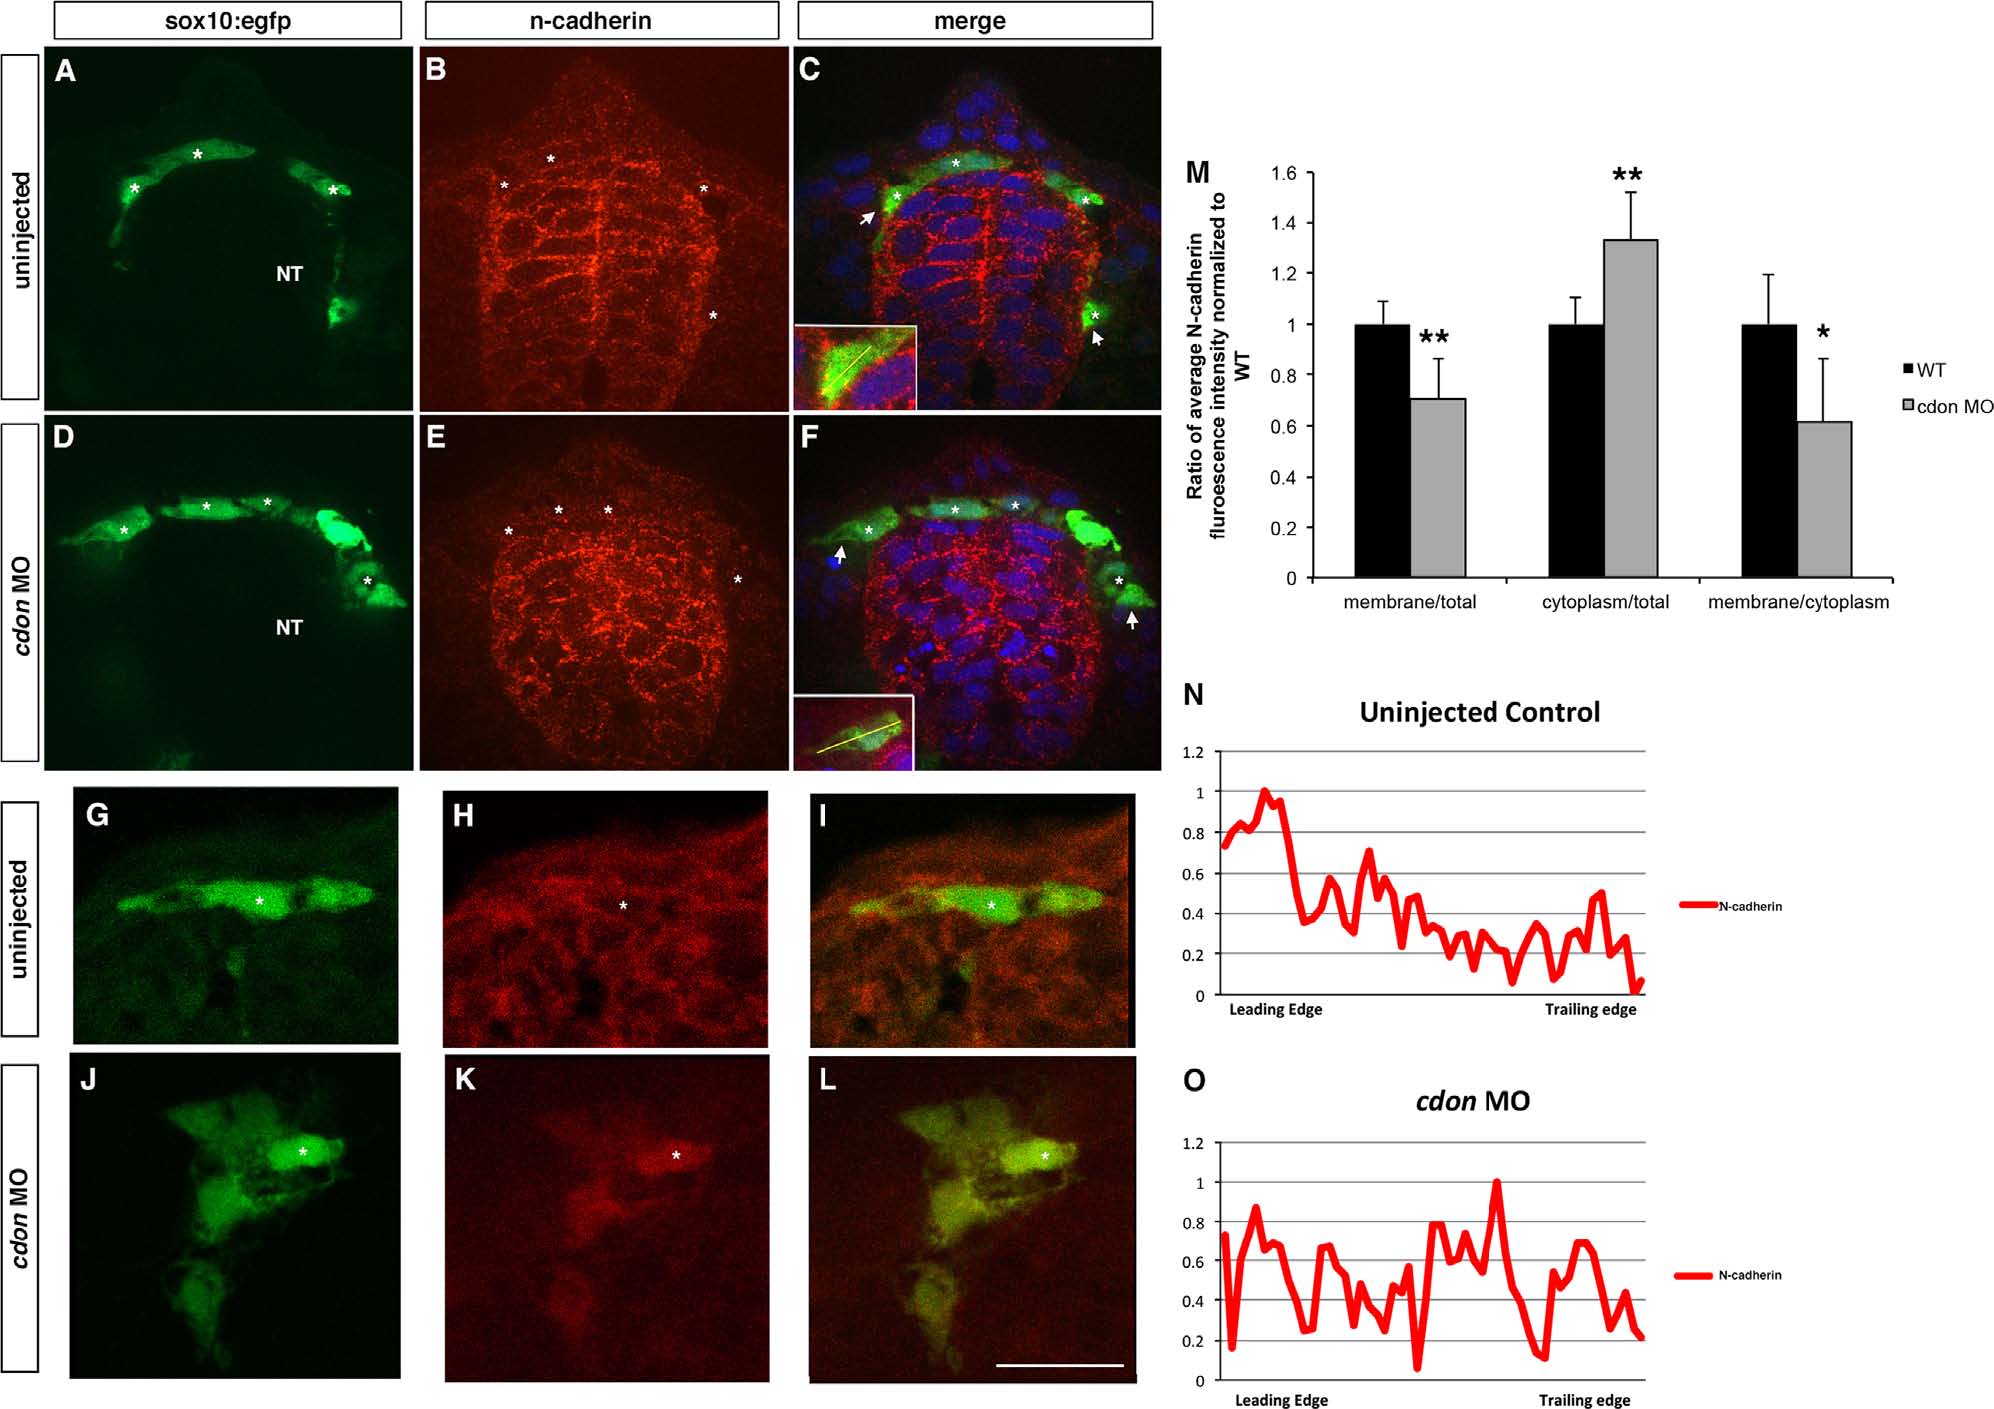
Fig. 6
N-cadherin is mislocalized in cdon morphant NCCs. Confocal images of cross-sectional immunofluorescent staining (12 µm sections, 1 µm optical sections) of the neural tube show N-cadherin localized to the cell surface of sox10:GFP-positive NCCs at 24 hpf (DAPI in blue, N-cadherin in red, sox10:GFP in green). (A)–(C) In wildtype embryos, N-cadherin is localized to the cell membrane leading edge, (D)–(F) while in cdon morphant NCCs, N-cadherin is evenly distributed in the cytoplasm. Insets in (C) and (F) show higher magnification of the triple labeled NCCs. (G)–(L) High magnification (63×) of a different group of neural crest cells in uninjected (G)–(I) and cdon MO injected (J)–(L) clearly demonstrating membrane localization in control neural crest cells while cdon knockdown cells have N-cadherin distributed evenly across the cell. (M)–(O) Fluorescent intensity of N-cadherin expression at the plasma membrane and cytoplasm was measured in ImageJ. Using plot profile, the midpoint of the cell was determined, and a line drawn through the center of the cell using the sox10-egfp positive cytoplasm to gate the membrane (ie at the edge of the gfp), shown as yellow line in inset, normalized from 0–1. From the line scan of fluorescence intensity, a line was then drawn down the center of the cell and ratios of membrane to total, cytoplasm to total, and membrane to cytoplasm were calculated for wildtype and cdon morphant NCCs; *p<0.05, **p<0.01. (N) and (O) Fluorescent intensity plot profile traces of migrating NCCs with ImageJ (NIH). In control cells, N-cadherin is expressed on the cell membrane and primarily on the leading edge membrane (n=13/16) while cdon MO cells show an even distribution across the cells (n=7/14) or a graded distribution (n=7/14) but without correlation to leading verses trailing edges. NT, neural tube; *’s denote migratory NCCs, along with arrows labeling the leading edge of most ventral migrating cells. Scale bar is 12 µm in L.
Reprinted from Developmental Biology, 407(2), Powell, D.R., Williams, J.S., Hernandez-Lagunas, L., Salcedo, E., O'Brien, J.H., Bruk Artinger, K., Cdon promotes neural crest migration by regulating N-cadherin localization, 289-99, Copyright (2015) with permission from Elsevier. Full text @ Dev. Biol.