
|
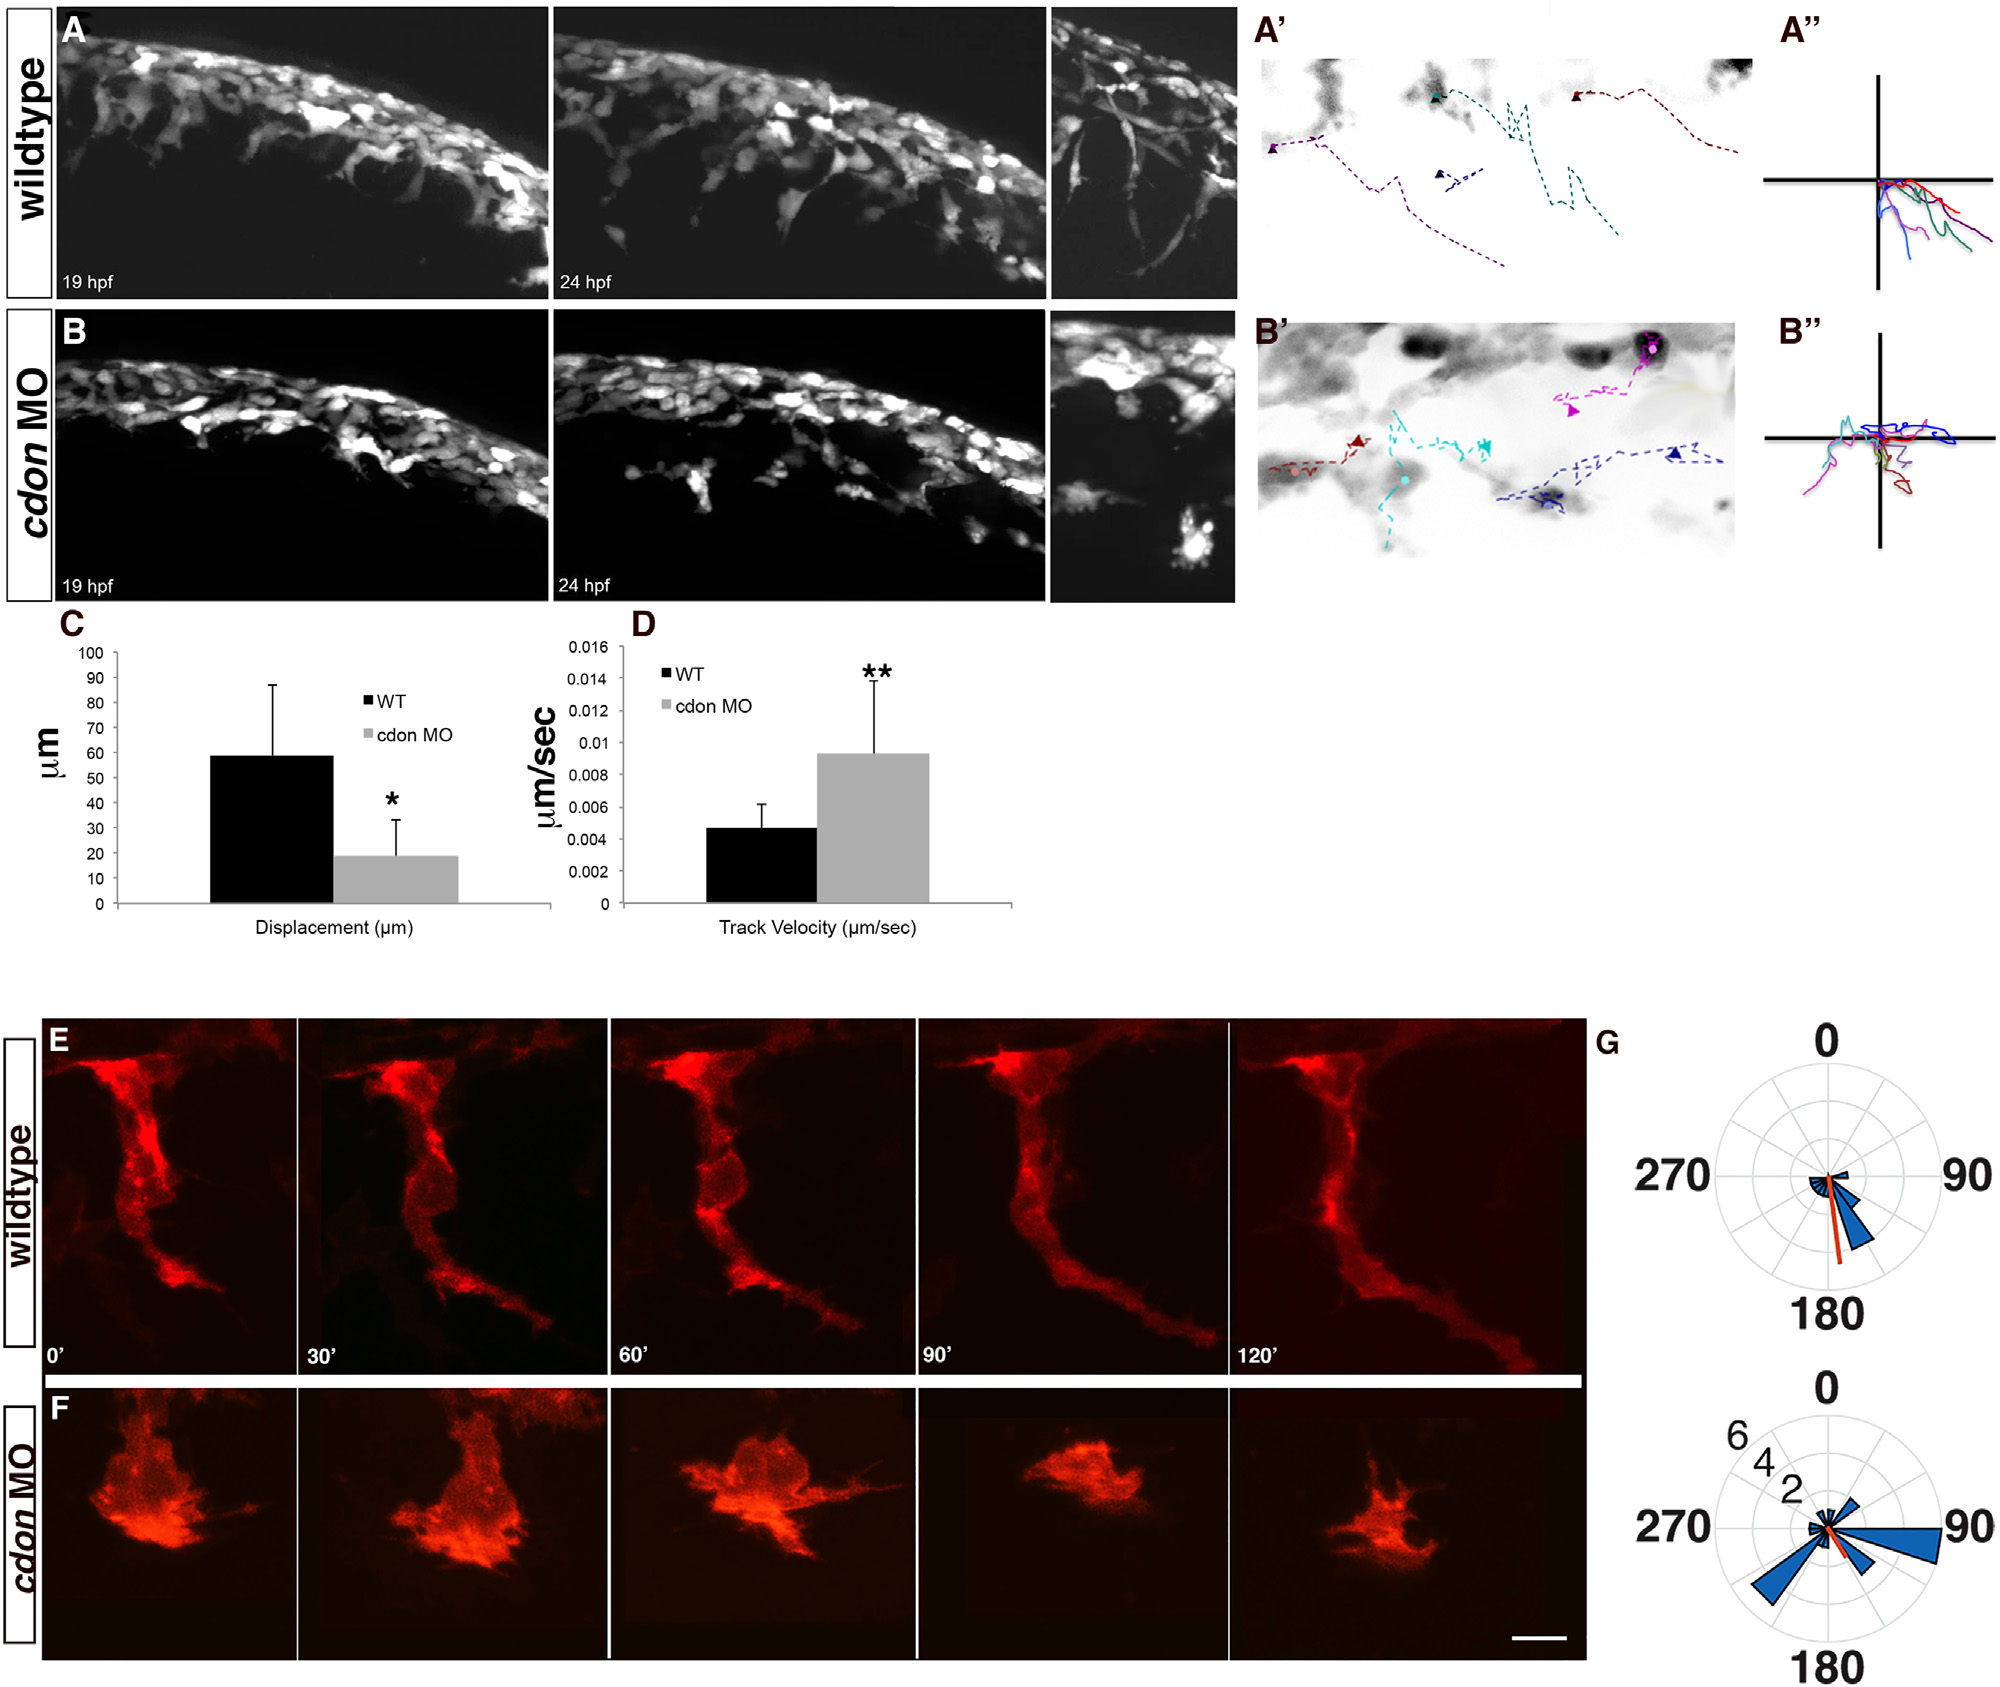
Fig. 3
The directedness of migration and cell protrusions is disrupted following cdon knockdown. Live imaging of wildtype (A) and cdon morphant (B) sox10:eGFP embryos from 19–24 hpf shows failure of directed NCC migration in cdon morphants. A high-resolution image of migrating NCCs (at approximately 22 hpf) in wildtype and cdon morphants (insets to the right) displays abnormal cellular morphology and protrusions in cdon morphant embryos. (A′) and (B′) Inverse images of migrating tracks in both wildtype (A′) and morphant embryos (B′) displays a lack of directed migration along the anterior–posterior axis in cdon morphant embryos (n=6 cells for each), cells are in black and colored dashed lines represent a trace of each individual cell over the time period. (A′′) and (B′′) A plot of traces of same cells in (A′) and (B′) to illustrate the anterior–posterior movement and loss of directed migration in cdon morphant NCCs as compared to wildtype cells. (C) and (D) Quantification of Displacement index (C) and Velocity (D) using Volocity Software (PerkinElmer) suggests increased motility and decreased directedness in cdon morphant NCCs. Displacement is a measure of straight-line distance from the first position to the last position with a higher number indicative more distance between the first and last point. For wildtype cells (n=6) the displacement index was 58.9±28.27 µm and in cdon MO (n=17) 18.68±14.45 µm; p=0.01. For velocity measurements, wildtype cells (n=6) were tracked at 0.0046±0.0015 µm/s whereas cdon MO cells (n=17) tracked at 0.00931±0.0046 µm/s; p=0.001. (E)–(G) Wildtype and cdon morphant NCC imaged in Tg(sox10:memRFP) over 120 min to determine the direction and number of cellular protrusions. (E) Wildtype cells have highly directed and stable protrusions (F). In the cdon morphant cells, the number and distribution of the protrusions is significantly increased as compared to wildtype cells (mean±sem=4.4±0.81 vs 2.0±0.25, respectively; unpaired T-test, p=0.0138), which gives the cells a more rounded appearance. (G) Rose plots show the distribution around a circle with 0° dorsal and 180° ventral. A circular T-test to quantify the directionality of the protrusions suggests that the wildtype cells are more directional then the cdon morphant NCCs and significantly departs from uniformity (length of red line, p<0.001) but the overall directionality (position of red line) is significantly different in the wildtype using the Rayleigh test of uniformity (p=1.21×10⁸) and trending towards significance in the cdon morphant NCCs (p=0.021). Numbers in G are position around a circle from 0–360 and length of wedge indicates the number of protrusions (2, 4, 6) of a given cell.
Reprinted from Developmental Biology, 407(2), Powell, D.R., Williams, J.S., Hernandez-Lagunas, L., Salcedo, E., O'Brien, J.H., Bruk Artinger, K., Cdon promotes neural crest migration by regulating N-cadherin localization, 289-99, Copyright (2015) with permission from Elsevier. Full text @ Dev. Biol.