- Title
-
Layer-specific targeting of direction-selective neurons in the zebrafish optic tectum
- Authors
- Gabriel, J.P., Trivedi, C.A., Maurer, C.M., Ryu, S., and Bollmann, J.H.
- Source
- Full text @ Neuron
|
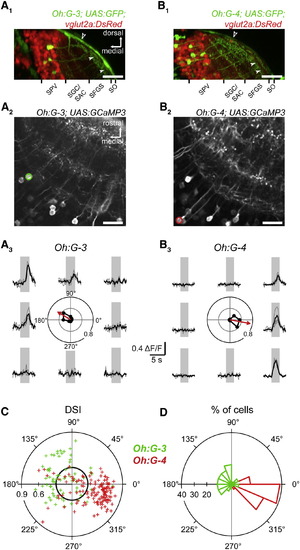
Somatic GCaMP3 Ca2+ Transients in Different Tectal Cell Classes (A1) Transverse optical section from a confocal stack through the optic tectum (OT) of a Tg(Oh:G-3;UAS:GFP;vGlut2a:DsRed) larva. Filled arrowheads represent border between SFGS and SO. Open arrowhead indicates skin fluorescence. Scale bar represents 50 µm.(A2) Optical section from a Tg(Oh:G-3;UAS:GCaMP3) larva in the central region of one tectal hemisphere. Dorsal view; circle shows cell analyzed in (A3). Scale bar represents 20 µm.(A3) Somatic Ca2+ transients measured in a cell in the Tg(Oh:G-3;UAS:GCaMP3) line during presentation of bars moving in eight directions. Center: polar plot of normalized peak amplitudes (black circles) and vector sum (red arrow).(B1) Transverse optical section from a confocal stack through the OT of a Tg(Oh:G-4;UAS:GFP;vGlut2a:DsRed) larva. Filled arrowheads represent border between SFGS and SO. Open arrowhead indicates skin fluorescence. Scale bar represents 50 µm.(B2) Optical section from a Tg(Oh:G-4;UAS:GCaMP3) larva in the central region of one tectal hemisphere. Dorsal view; circle shows cell analyzed in (B3). Scale bar represents 20 µm.(B3) Same as (A3) but for somatic Ca2+ transients in the cell marked in (B2).(C) DSI and PD for cells imaged in Tg(Oh:G-3;UAS:GCaMP3) (green) and Tg(Oh:G-4;UAS:GCaMP3) (red) that showed responses to moving bars. For [Oh:G-3], a total of 112 cells were analyzed, 69 of which responded to moving bars (61.6%). For [Oh:G-4], a total of 217 cells were analyzed, 138 of which responded to moving bars (63.6%). Black circle marks a DSI of 0.3.(D) Histogram of PDs for all DS cells from (C) ([Oh:G-3]: 52 of 69 = 75.4% of responsive cells; 52 of 112 = 46.4% of all cells; [Oh:G-4]: 118 of 138 = 85.5% of responsive cells; 118 of 217 = 54.4% of all cells). |
|
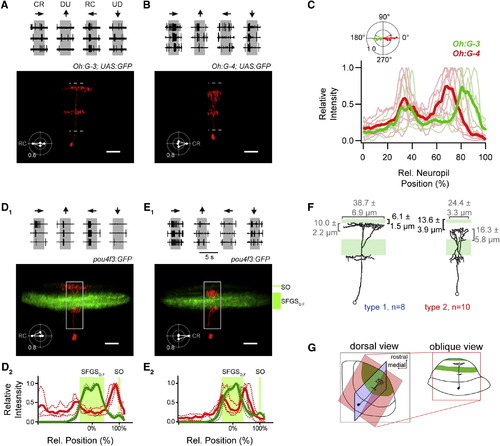
Morphology of Direction-Selective Neurons(A) Top: cell-attached recording of a GFP-positive neuron in the Tg(Oh:G-3;UAS:GFP) line during moving bars in four directions (three individual traces per direction). Bottom: the same cell, after break-in, filled with sulforhodamine-B (SR-B). Maximum intensity projection is shown in an oblique view (see G). Inset: polar plot of the normalized number of spikes during moving bar stimulation, RC is PD. Dashed lines indicate neuropil boundaries. Scale bar represents 20 µm.(B) Same as (A) but for a GFP-positive neuron in the Tg(Oh:G-4;UAS:GFP) line. Polar plot of normalized number of spikes shows preference for CR moving bars (inset). Scale bar represents 20 µm. Somatic pipette in (A) and (B) was removed for clarity.(C) Fluorescence profiles of individual tectal cells in the Oh:G-3 (green) and Oh:G-4 (red) background, respectively. Thin traces represent intensity profiles of single filled cells in an oblique view (as in A and B). Zero percent corresponds to the boundary between periventricular cell body layer (SPV) and the neuropil, 100% corresponds to the dorsal surface of the neuropil (see dashed lines in A and B). Thick traces indicate average profiles (Oh:G-3, n = 5; Oh:G-4, n = 7).(D1) Top: recording of cell spiking from a randomly selected neuron in the Tg(pou4f3:GFP) line, tuned for RC moving stimuli (polar plot). Bottom: maximum intensity projection of the same cell, after break-in, filled with SR-B (red) in relation to GFP fluorescence of retinal afferent layers (green) in an oblique view. Note the thin afferent SO layer (top) and the broad SFGSD,F layers. Scale bar represents 20 µm.(D2) Fluorescence profiles of individual RC-tuned cells in the Tg(pou4f3:GFP) line (red traces) and location of retinal afferent layers (SFGSD,F, SO) in the same tecta (green traces). Thin dotted traces indicate single cell profiles (n = 3), thick traces represent average profiles. The midpoint of the SFGSD,F band and the peak of the SO band serve as calibration marks (0%, 100% relative distance, respectively).(E1) Top: same as in (D1) but for a randomly selected neuron in the Tg(pou4f3:GFP) line, tuned for CR moving stimuli. Bottom: maximum intensity projection of the same cell, after break-in, filled with SR-B (red) in relation to GFP fluorescence of retinal afferent layers (green). Scale bar represents 20 µm.(E2) Fluorescence profiles of individual CR-tuned cells in the Tg(pou4f3:GFP) line (red traces) and location of retinal afferent layers (SFGSD,F, SO). Thin dotted traces indicate single cell profiles (n = 3), thick traces represent average profiles.(F) Summary of morphological properties of DS cells. RC cells pooled from Oh:G-3 and pou4f3:GFP and CR cells pooled from Oh:G-4 and pou4f3:GFP. Reconstructions show same neurons as in (A) and (B). Numbers specify the width, thickness, and distance from dorsal surface of the top dendritic compartment (mean ± SEM).>(G) Schematic of viewing planes of cells and tectal layers shown in (A–F). |
|
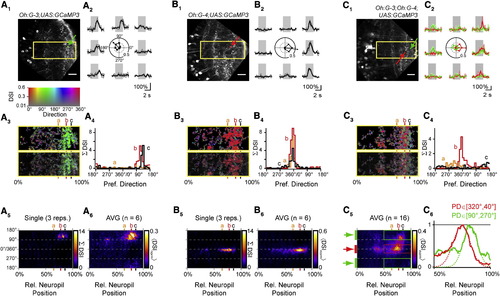
Directional Tuning of Dendritic Ca2+ Transients in Distinct Classes of Tectal Neurons(A1–A6) Dendritic Ca2+ signals in the Oh:G-3 background are tuned to moving stimuli with an RC component.(A1) Optical section of neuropil in a Tg(Oh:G-3;UAS:GCaMP3) fish. Image is rotated to orient tectal layers vertically. Yellow rectangle circumscribes region shown in (A3). Small green square and arrow indicate sliding ROI to analyze local Ca2+ signals. Scale bar represents 20 µm.(A2) Ca2+ transients measured in the small green box in (A1) in response to bars moving in eight directions (grey lines, individual traces; black line, average). Center: polar plot of normalized peak amplitudes of Ca2+ transients measured in green square from (A1). Arrow shows vector sum of normalized peak amplitudes, indicating PD and DSI.(A3) Top: color map encoding local PD and DSI for rectangular region shown in (A1). Hue encodes direction, and saturation indicates DSI value (compare color table in inset). Bottom: color map overlaid with grayscale image.(A4) Histograms of local PDs in the neuropil at three levels from the SPV/neuropil boundary. Levels are indicated by vertical lines in (A3); level a, 65%; level b, 78%; level c, 86% relative distance. Histograms represent the sum of DSI values for binned PDs (bin width 10°) at a given relative distance within the neuropil.(A5) Color representation of histograms of PDs from deep (0%) to superficial (100%) boundary in the neuropil. Color encodes summed DSIs (DSI). Columns at levels a, b, and c correspond to PD histograms shown in (A4). Data are from a single trial (three repetitions of eight stimulus directions, same as A1–A4).(A6) Average of color PD histograms from six Tg(Oh:G-3;UAS:GCaMP3) fish. Individual color histograms were normalized and averaged < DSInorm >. Note a pronounced accumulation of DSI for stimuli with RC components (between 90° and 270°).(B1–B6) Same as (A1–A6) but for Tg(Oh:G-4;UAS:GCaMP3). A small sliding ROI (red square and arrow in B1) was used to calculate local PD and DSI. Note that the neuropil Ca2+ signals are substantially tuned for CR directions (0°) in the single trial (B5, same data as B1–B4) and the average PD histogram from six fish (B6).(C1) Optical section of neuropil in a triple transgenic Tg(Oh:G-3;Oh:G-4;UAS:GCaMP3) fish.(C2) Ca2+ transients measured from small boxed ROIs (red and green arrows in C1, respectively) during the same stimulus trial. Center: corresponding polar plot with normalized ”F/F amplitudes and PD, showing opposite tuning.(C3) Top: color map encoding local PD and DSI for rectangular region in (C1). Color look-up table is the same as in inset above (A3). Bottom: color map overlaid with grayscale image.(C4) Histograms of local PDs at levels a, b, and c in the neuropil in this line. Same binning method as in (A4). Different layers prefer different directions in the same trial.(C5) Color representation of PD histograms from 0% to 100% relative distance in neuropil in the Tg(Oh:G-3;Oh:G-4;UAS:GCaMP3) line. Average map from 16 optical sections in nine fish, normalized and averaged as in (A6) and (B6). Color encodes mean normalized DSIs (<DSInorm >).(C6) Intensity profiles measured between the 50% and 100% level of neuropil. Profiles were averaged for CR directions (red bar in C5, red line in C6) and for RC directions (green bars in C5, green line in C6) separately. DSI for RC directions exhibits a maximum at more superficial levels than that for CR directions (dashed lines are Gaussian fit curves). |
|
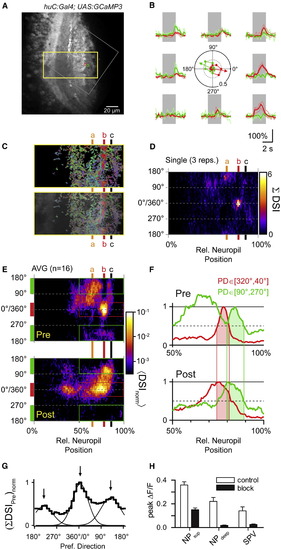
Laminar Organization of Direction Selectivity in Presynaptic Compartments of Tectal Neuropil(A) Optical section of neuropil in a Tg(huC:Gal4;UAS:GCaMP3) larva. Grey square indicates region imaged at higher spatial resolution. Yellow rectangle circumscribes region shown in (C). Small green and red squares indicate sliding ROI to analyze local Ca2+ signals. Scale bar represents 20 µm.(B) Ca2+ transients measured in the small green and red square in (A) in response to moving bars (thin lines, individual traces; thick line, average). Center: polar plot of normalized peak amplitudes of Ca2+ transients measured in green and red square from (A). PD and DSI indicated by green and red arrows.(C) Top: color map encoding local PD and DSI for rectangular region in (A). Color look-up table is the same as in the inset in A. Bottom: color map overlaid with grayscale image.(D) Color representation of histograms of PDs from deep (0%) to superficial (100%) boundary in the neuropil during block of postsynaptic activity. Color encodes summed DSIs (DSI). Levels a, b, and c (65%, 78%, and 86% relative distance) are indicated in (C–E) for comparison. Data are from a single trial (three repetitions of eight stimulus directions).(E) Top: presynaptic PD histograms averaged from 16 optical sections in seven fish. Individual color histograms were normalized and averaged < DSInorm >. Note the pronounced accumulation of CR directional signals near level b versus non-CR directional signals above and below this layer. Bottom: postsynaptic PD histogram from the Tg(Oh:G-3;Oh:G-4;UAS:GCaMP3) line, same plot as in Figure 5C5, for comparison. Note the overlap of CR directional signals near level b and the overlap of RC directional signals at more superficial levels near level c. Note logarithmic color scale, which applies to both panels.(F) Intensity profiles measured between the 50% and 100% level of neuropil in the Tg(huC:Gal4;UAS:GCaMP3) line (“Pre”) and the Tg(Oh:G-3;Oh:G-4;UAS:GCaMP3) line (“Post”). Profiles were averaged for CR directions (red bars in E, red curves in F) and for RC directions (green bars in E, green curves in F) separately and peak scaled for the distal maximum. Pre- and postsynaptic directional signals show substantial overlap for CR and RC stimuli, respectively (shaded areas).(G) Histogram of presynaptic PDs in the top 35% of tectal neuropil. DSIs were summed according to binned PDs, exhibiting three peaks (5°, CR; 129°, RC-DU; and 218°, RC-UD). Smooth curves are Gaussian fits to histogram.(H) Comparison of somatic and neuropil Ca2+ signals during local application of APV and CNQX and during control (NPsup, superficial neuropil; NPdeep, deep neuropil, SPV, periventricular cell body layer). Error bars indicate mean ± SEM. |
|
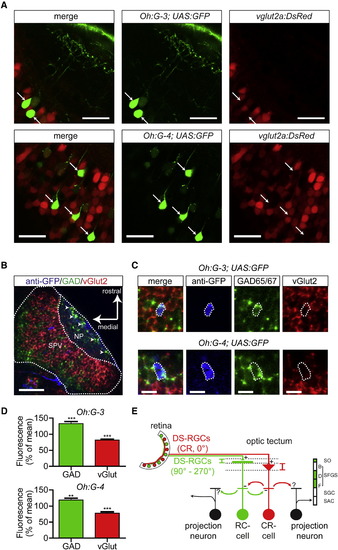
Neurotransmitter Phenotype of Direction-Selective Neurons in Specific Gal4 Lines(A) Tg(Oh:G-3;UAS:GFP) fish (top row) and Tg(Oh:G-4;UAS:GFP) fish (bottom row) were crossed with Tg(vglut2a:DsRed) fish (confocal images). In both Tg(Oh:G-3) and Tg(Oh:G-4) fish, brightly labeled GFP-positive cells (arrows) were negative for DsRed. Scale bar represents 20 µm.(B) Confocal image of a whole-mount in situ hybridization of a Tg(Oh:G-3;UAS:GFP) larva. NP, neuropil; SPV, periventricular cell body layer. Arrowheads point to GABAergic SINs. Scale bar represents 50 µm.(C) Details of a whole-mount in situ hybridization of Tg(Oh:G-3;UAS:GFP) and Tg(Oh:G-4;UAS:GFP). Scale bar represents 10 µm. Note that anti-GFP-labeled cells (blue) are visible in the green (gad65/67) channel but not in the red (vglut2) channel.(D) In confocal images from the whole-mount in situ hybridization of Tg(Oh:G-3;UAS:GFP) and Tg(Oh:G-4;UAS:GFP), the mean fluorescence intensity within the region of GFP-positive somata in the GAD65/67 channel (green) and vGlut2 channel (red) was measured and normalized to the respective mean fluorescence intensity outside the soma (after background subtraction). In both lines, green fluorescence was significantly higher within GFP-positive somatic regions than outside. Red fluorescence was significantly lower within these GFP-positive somatic regions (Tg(Oh:G-3;UAS:GFP): n = 42 somata; Tg(Oh:G-4;UAS:GFP): n = 40 somata). Error bars indicate mean ± SEM.(E) Schematic drawing representing a possible DS circuit motif in OT. DS type 1 and type 2 cells receive DS excitatory input from layer-specific DS-RGC axons and may provide reciprocal inhibition onto each other and onto other, unidentified tectal neurons. |
|
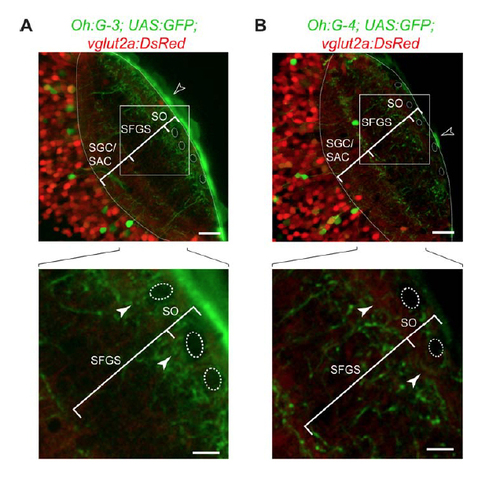
Characterization of novel Gal4 lines (A) Tg(Oh:G-3;UAS:GFP) fish were crossed with Tg(vglut2a:DsRed) fish to obtain triple transgenic animals (optical section from a confocal stack; dorsal view). In the SO, superficial interneurons (SINs) can be detected as dark shadows, serving as landmarks (dashed outlines) (Del Bene et al., 2010). GFP-positive processes are present near the SFGS/SO border (filled arrowheads in lower panel). In this line, 3 there is bright skin fluorescence (open arrowhead, upper panel). Scale bar: 20 µm (upper panel) / 10 µm (lower panel). (B) In Tg(Oh:G-4;UAS:GFP;vglut2a:DsRed) animals, GFP-labeled processes are absent from the SFGS/SO border (filled arrowheads in lower panel). Scale bar: 20 µm (upper panel) / 10 µm (lower panel). Skin fluorescence marked by open arrowhead (upper panel). |
|
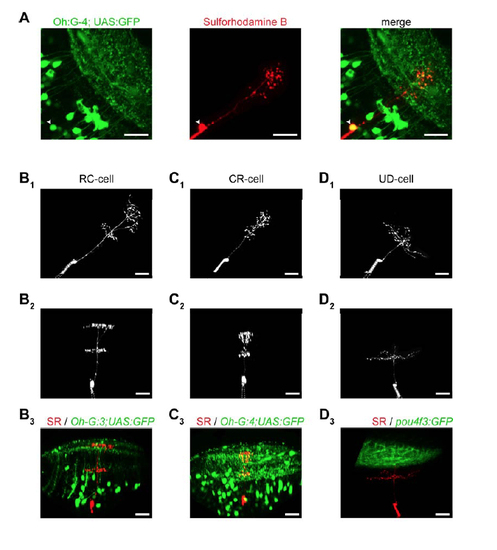
Multiphoton targeted patch recordings in transgenic lines and comparison of cell morphology (A) Example of fluorescently labeled cells in a Tg(Oh:G-4;UAS:GFP) animal, one of which (arrowhead) we recorded from and filled with sulforhodamine B via the patch electrode. Scale bar: 20 µm. (B1) Dorsal view of the type-1 cell in a Tg(Oh:G-3;UAS:GFP) animal, shown in Fig.3A. The recording electrode is visible in the lower left corner (dashed lines). Scale bar in this and all other panels: 20 µm. (B2) Oblique view of the same neuron showing the laminar structure of the neuritic arbors. The tip of the recording electrode is visible below the soma. (B3) Same neuron as in B1, B2 (shown in red, SR: sulforhodamine B) patched in the Tg(Oh:G-3;UAS:GFP) animal, shown together with the GFP channel. Note that some GFP labeled structures (e.g. vasculature, displaced cells) appear in the neuropil in the maximum intensity projection. While the SPV/neuropil boundary near the imaged cell (lower dashed line in Fig. 3A,B) is difficult to see in these projections, it could reliably be determined in individual sections of the image stack containing the primary dendrite in both the green and red channel. (C1) (C2) Dorsal and oblique view of the type-2 cell from Fig. 3B, respectively. (C3) The same neuron, which was patched in the Tg(Oh:G-4;UAS:GFP) line, shown together with the GFP channel (maximum-intensity projection). (D1) (D2) Dorsal and oblique view of a UD-DS cell (a deep cell), respectively. (D3) The same neuron, which was patched in the Tg(pou4f3:GFP) line, shown together with the GFP channel, indicating that deep neurons do not arborize in the SFGS. |
|
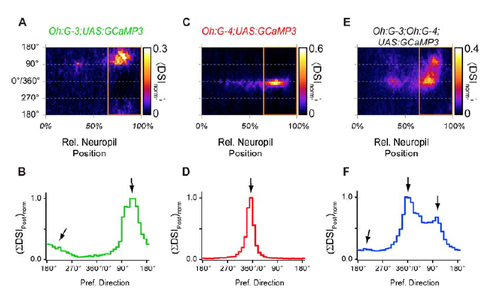
Distribution of preferred directions in postsynaptic compartments in the superficial neuropil in different transgenic lines (A) Two-dimensional histogram of preferred directions in the neuropil of Tg(Oh:G-3;UAS:GCaMP3 fish. Average of normalized PD histograms from 6 individual fish (same as in Fig. 5A6). Orange rectangle corresponds to upper (superficial) 35% of the neuropil, in which the DSIs were sorted by preferred directions (36 directions, bin width: 10°) and summed to construct the histogram in panel B. (B) Distribution of summed DSIs, sorted by preferred direction, and normalized. In each directional bin (rows in panel A, bin width 10°), the DSIs in the top 35% of neuropil (right area in panel A, marked by orange rectangle) were summed to calculate a relative ‘directional content’ in the postsynaptic compartments in this transgenic line. In Tg(Oh:G-3;UAS:GCaMP3), directional signals in postsynaptic compartments exhibit the highest summed DSIs for directions between 90° and 7 270°, with a peak at 130° (right arrow), a tail towards higher angles (left arrow), and a minimum between 270°-360°. This is in qualitative agreement with the distribution of PDs in somatic Ca2+ measurements in this line (Fig. 2C,D). (C) Same as in A, but for the Tg(Oh:G-4;UAS:GCaMP3) line. DSIs were largest for directions near the 0° (CR) direction in this line (same data as in Fig. 5B6). (D) Distribution of summed DSIs for the Tg(Oh:G-4;UAS:GCaMP3) line. Same analysis as in B. Here, postsynaptic directional signals exhibit the highest summed DSIs in the 10°-bin centered around 355°, corresponding to CR-directions, consistent with pronounced CR-tuning of somatic Ca2+ signals in this line (Fig. 2C,D). (E) Same as in A, but for the triple transgenic Tg(Oh:G-3;Oh:G-4;UAS:GCaMP3) line. (F) Distribution of summed DSIs in the triple transgenic Tg(Oh:G-3;Oh:G-4;UAS:GCaMP3) line. Here, postsynaptic directional signals exhibit peaks at 0° (CRdirection, center arrow), at 105° (right arrow) and a small elevation at 205° (left arrow), consistent with a combination of preferred directions observed separately in Tg(Oh:G-3;UAS:GCaMP3) and Tg(Oh:G-4;UAS:GCaMP3). |
|
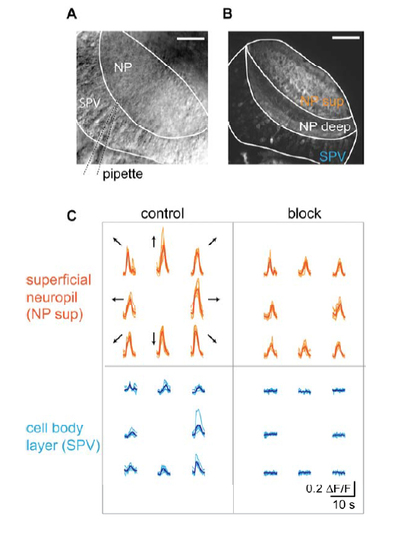
Pharmacological block of postsynaptic activity (A) Dorsal view of a tectal hemisphere imaged with an infrared-sensitive transillumination dectector below the recording chamber. Tectal neuropil (NP) and cell body layer (SPV: stratum periventriculare) are visible, as well as the broken patch pipette (dashed lines) that is used to locally apply inhibitors of ionotropic 9 glutamate receptor channels by weak positive pressure. Rostral is to the top. Scale bar: 40 µm. (B) Dorsal view of a tectal hemisphere imaged in a Tg(huC:Gal4;UAS:GCaMP3) animal showing neuropil structure (NP sup: superficial neuropil innervated by RGC axons; NP deep: deep neuropil) and cell body layer (SPV). Scale bar: 40 µm. (C) Ca2+ transients from the regions shown in (B) during presentation of bars moving in eight directions before (“control”) and during local application of 20-100 µM APV and 10-50 µM CNQX (“block”) by maintaining weak positive pressure in the application pipette for several minutes. |

