
|
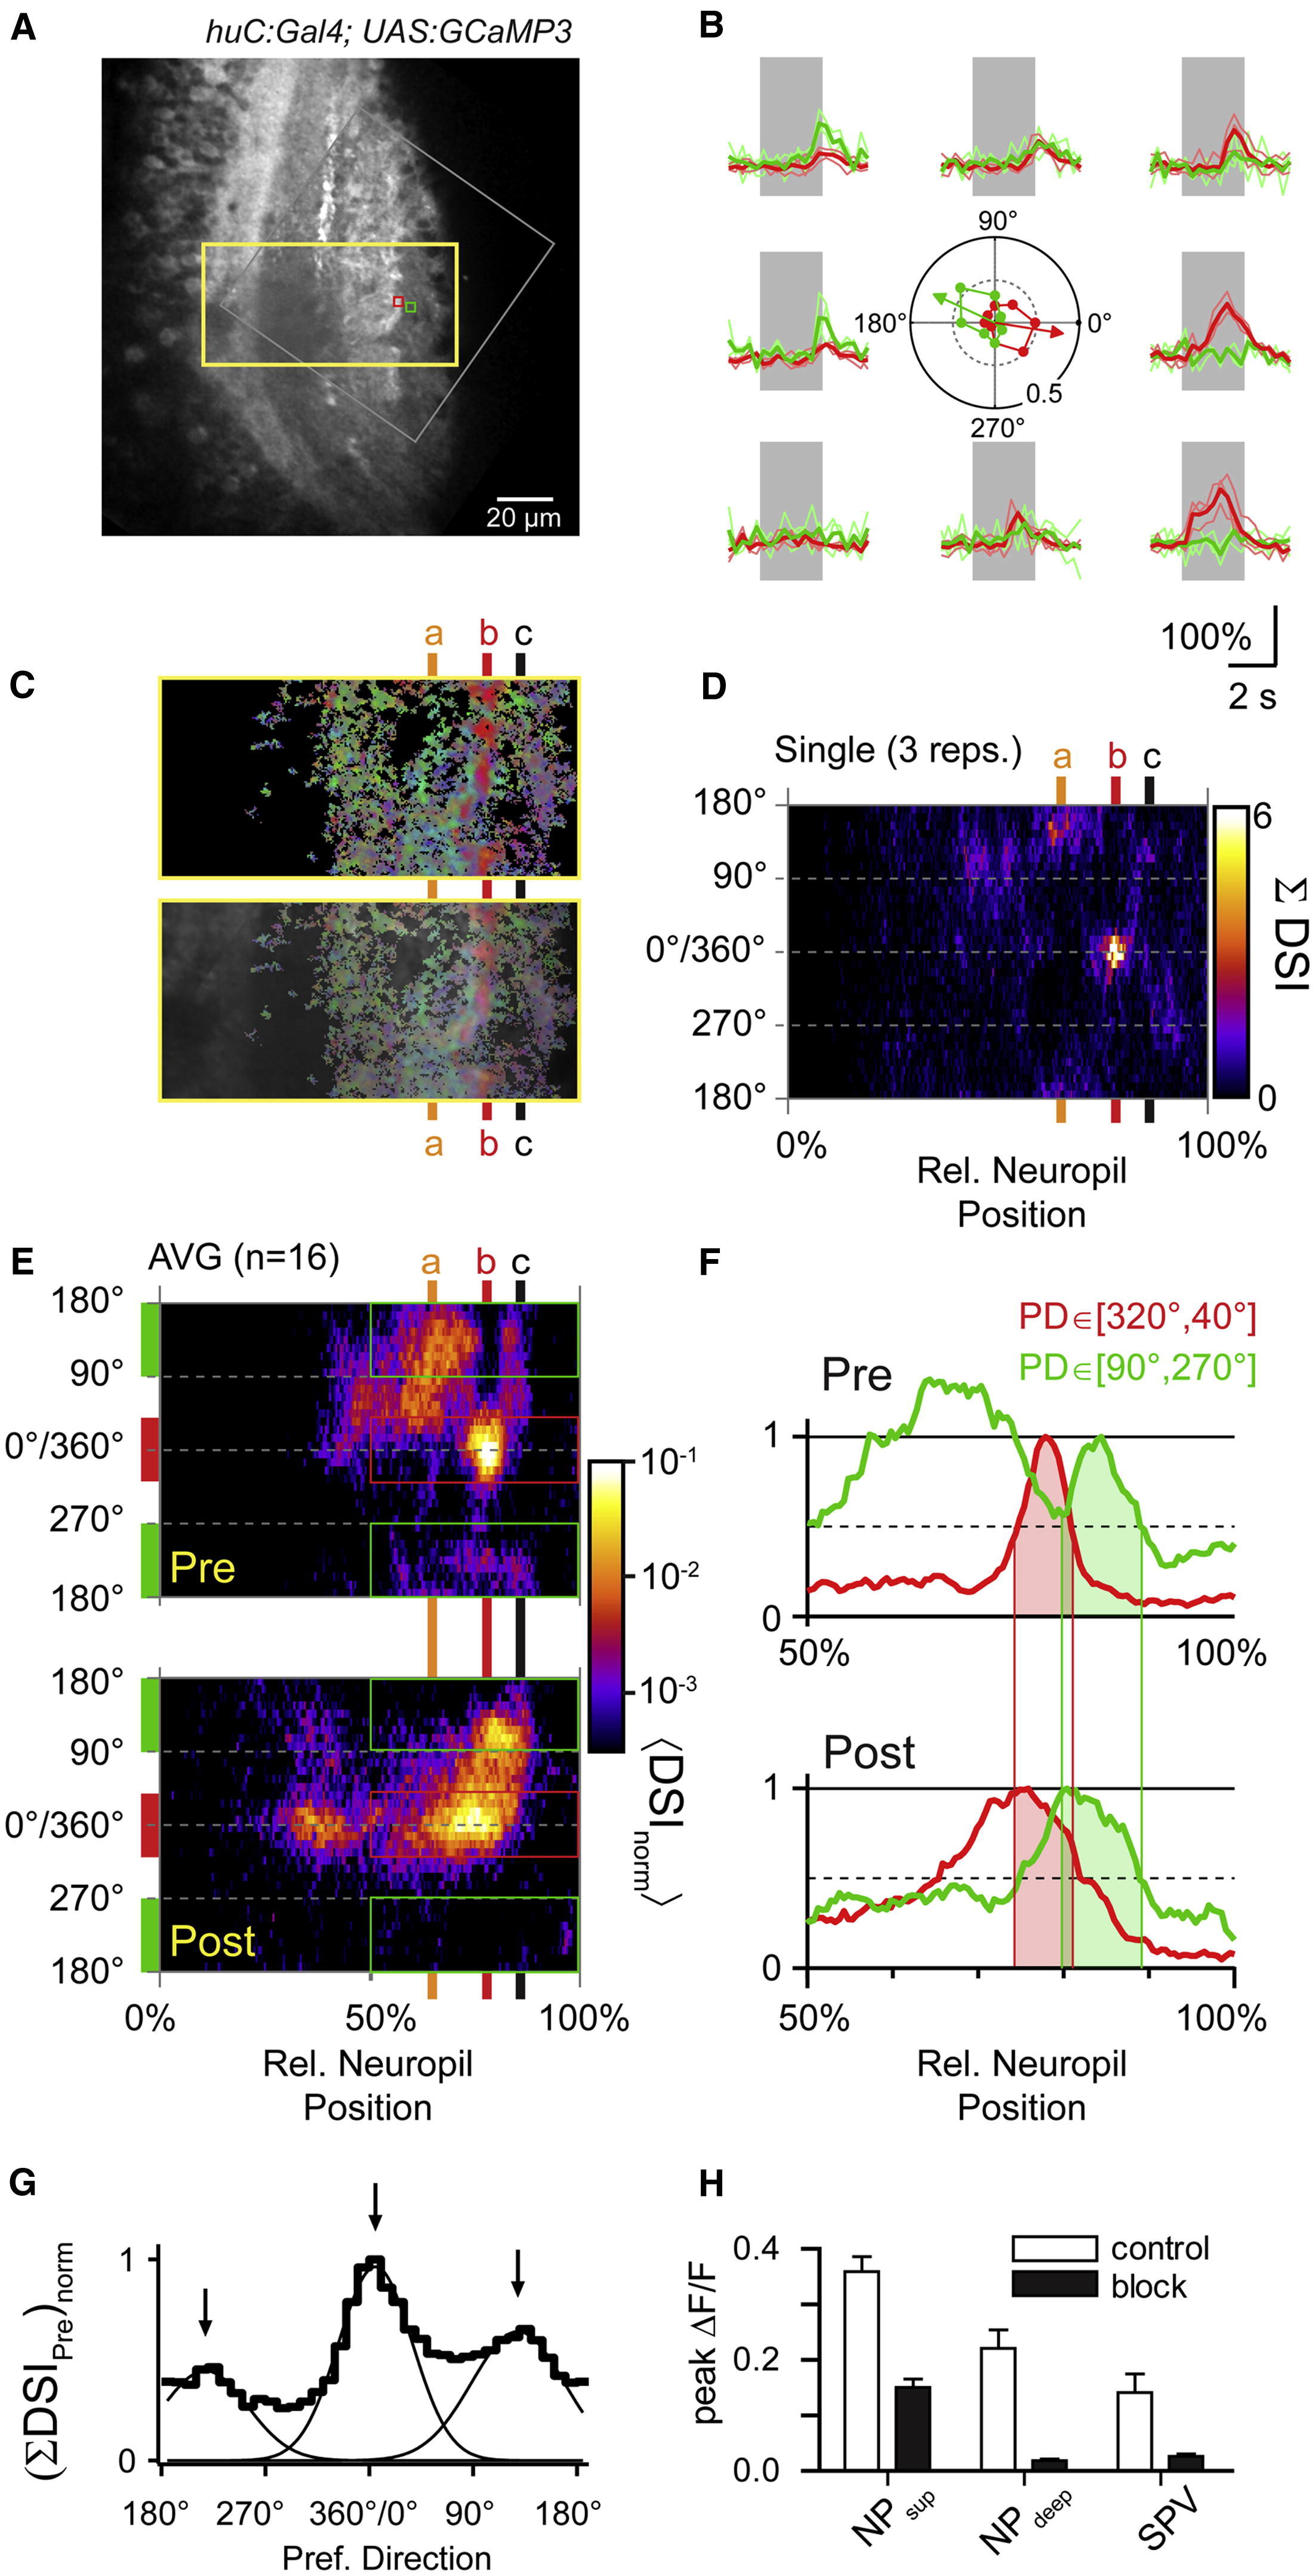
Fig. 6
Laminar Organization of Direction Selectivity in Presynaptic Compartments of Tectal Neuropil(A) Optical section of neuropil in a Tg(huC:Gal4;UAS:GCaMP3) larva. Grey square indicates region imaged at higher spatial resolution. Yellow rectangle circumscribes region shown in (C). Small green and red squares indicate sliding ROI to analyze local Ca2+ signals. Scale bar represents 20 µm.(B) Ca2+ transients measured in the small green and red square in (A) in response to moving bars (thin lines, individual traces; thick line, average). Center: polar plot of normalized peak amplitudes of Ca2+ transients measured in green and red square from (A). PD and DSI indicated by green and red arrows.(C) Top: color map encoding local PD and DSI for rectangular region in (A). Color look-up table is the same as in the inset in A. Bottom: color map overlaid with grayscale image.(D) Color representation of histograms of PDs from deep (0%) to superficial (100%) boundary in the neuropil during block of postsynaptic activity. Color encodes summed DSIs (DSI). Levels a, b, and c (65%, 78%, and 86% relative distance) are indicated in (C–E) for comparison. Data are from a single trial (three repetitions of eight stimulus directions).(E) Top: presynaptic PD histograms averaged from 16 optical sections in seven fish. Individual color histograms were normalized and averaged < DSInorm >. Note the pronounced accumulation of CR directional signals near level b versus non-CR directional signals above and below this layer. Bottom: postsynaptic PD histogram from the Tg(Oh:G-3;Oh:G-4;UAS:GCaMP3) line, same plot as in Figure 5C5, for comparison. Note the overlap of CR directional signals near level b and the overlap of RC directional signals at more superficial levels near level c. Note logarithmic color scale, which applies to both panels.(F) Intensity profiles measured between the 50% and 100% level of neuropil in the Tg(huC:Gal4;UAS:GCaMP3) line (“Pre”) and the Tg(Oh:G-3;Oh:G-4;UAS:GCaMP3) line (“Post”). Profiles were averaged for CR directions (red bars in E, red curves in F) and for RC directions (green bars in E, green curves in F) separately and peak scaled for the distal maximum. Pre- and postsynaptic directional signals show substantial overlap for CR and RC stimuli, respectively (shaded areas).(G) Histogram of presynaptic PDs in the top 35% of tectal neuropil. DSIs were summed according to binned PDs, exhibiting three peaks (5°, CR; 129°, RC-DU; and 218°, RC-UD). Smooth curves are Gaussian fits to histogram.(H) Comparison of somatic and neuropil Ca2+ signals during local application of APV and CNQX and during control (NPsup, superficial neuropil; NPdeep, deep neuropil, SPV, periventricular cell body layer). Error bars indicate mean ± SEM.