
|
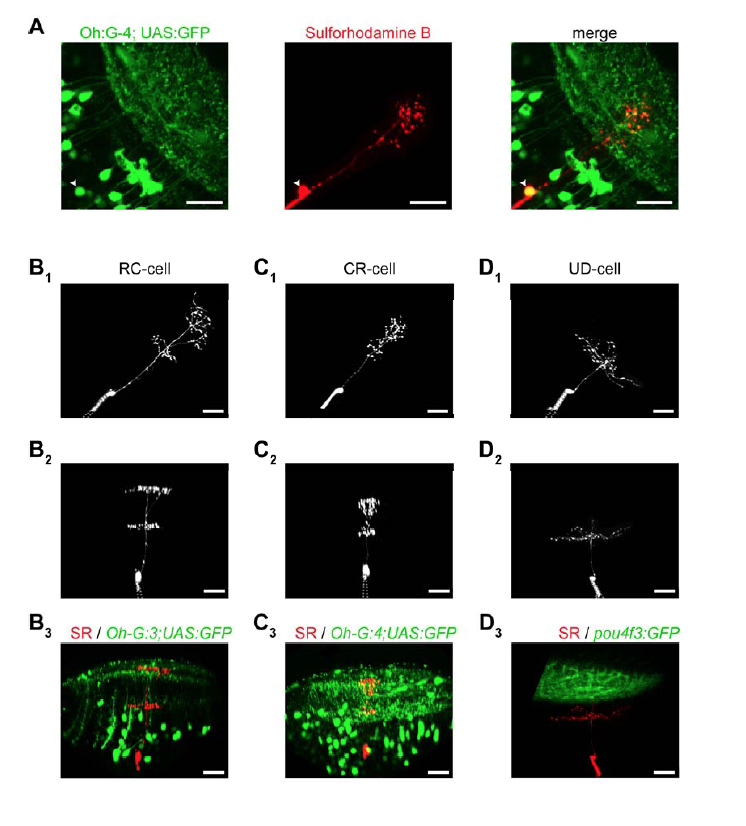
Fig. S2 Multiphoton targeted patch recordings in transgenic lines and comparison of cell morphology (A) Example of fluorescently labeled cells in a Tg(Oh:G-4;UAS:GFP) animal, one of which (arrowhead) we recorded from and filled with sulforhodamine B via the patch electrode. Scale bar: 20 µm. (B1) Dorsal view of the type-1 cell in a Tg(Oh:G-3;UAS:GFP) animal, shown in Fig.3A. The recording electrode is visible in the lower left corner (dashed lines). Scale bar in this and all other panels: 20 µm. (B2) Oblique view of the same neuron showing the laminar structure of the neuritic arbors. The tip of the recording electrode is visible below the soma. (B3) Same neuron as in B1, B2 (shown in red, SR: sulforhodamine B) patched in the Tg(Oh:G-3;UAS:GFP) animal, shown together with the GFP channel. Note that some GFP labeled structures (e.g. vasculature, displaced cells) appear in the neuropil in the maximum intensity projection. While the SPV/neuropil boundary near the imaged cell (lower dashed line in Fig. 3A,B) is difficult to see in these projections, it could reliably be determined in individual sections of the image stack containing the primary dendrite in both the green and red channel. (C1) (C2) Dorsal and oblique view of the type-2 cell from Fig. 3B, respectively. (C3) The same neuron, which was patched in the Tg(Oh:G-4;UAS:GFP) line, shown together with the GFP channel (maximum-intensity projection). (D1) (D2) Dorsal and oblique view of a UD-DS cell (a deep cell), respectively. (D3) The same neuron, which was patched in the Tg(pou4f3:GFP) line, shown together with the GFP channel, indicating that deep neurons do not arborize in the SFGS.