
|
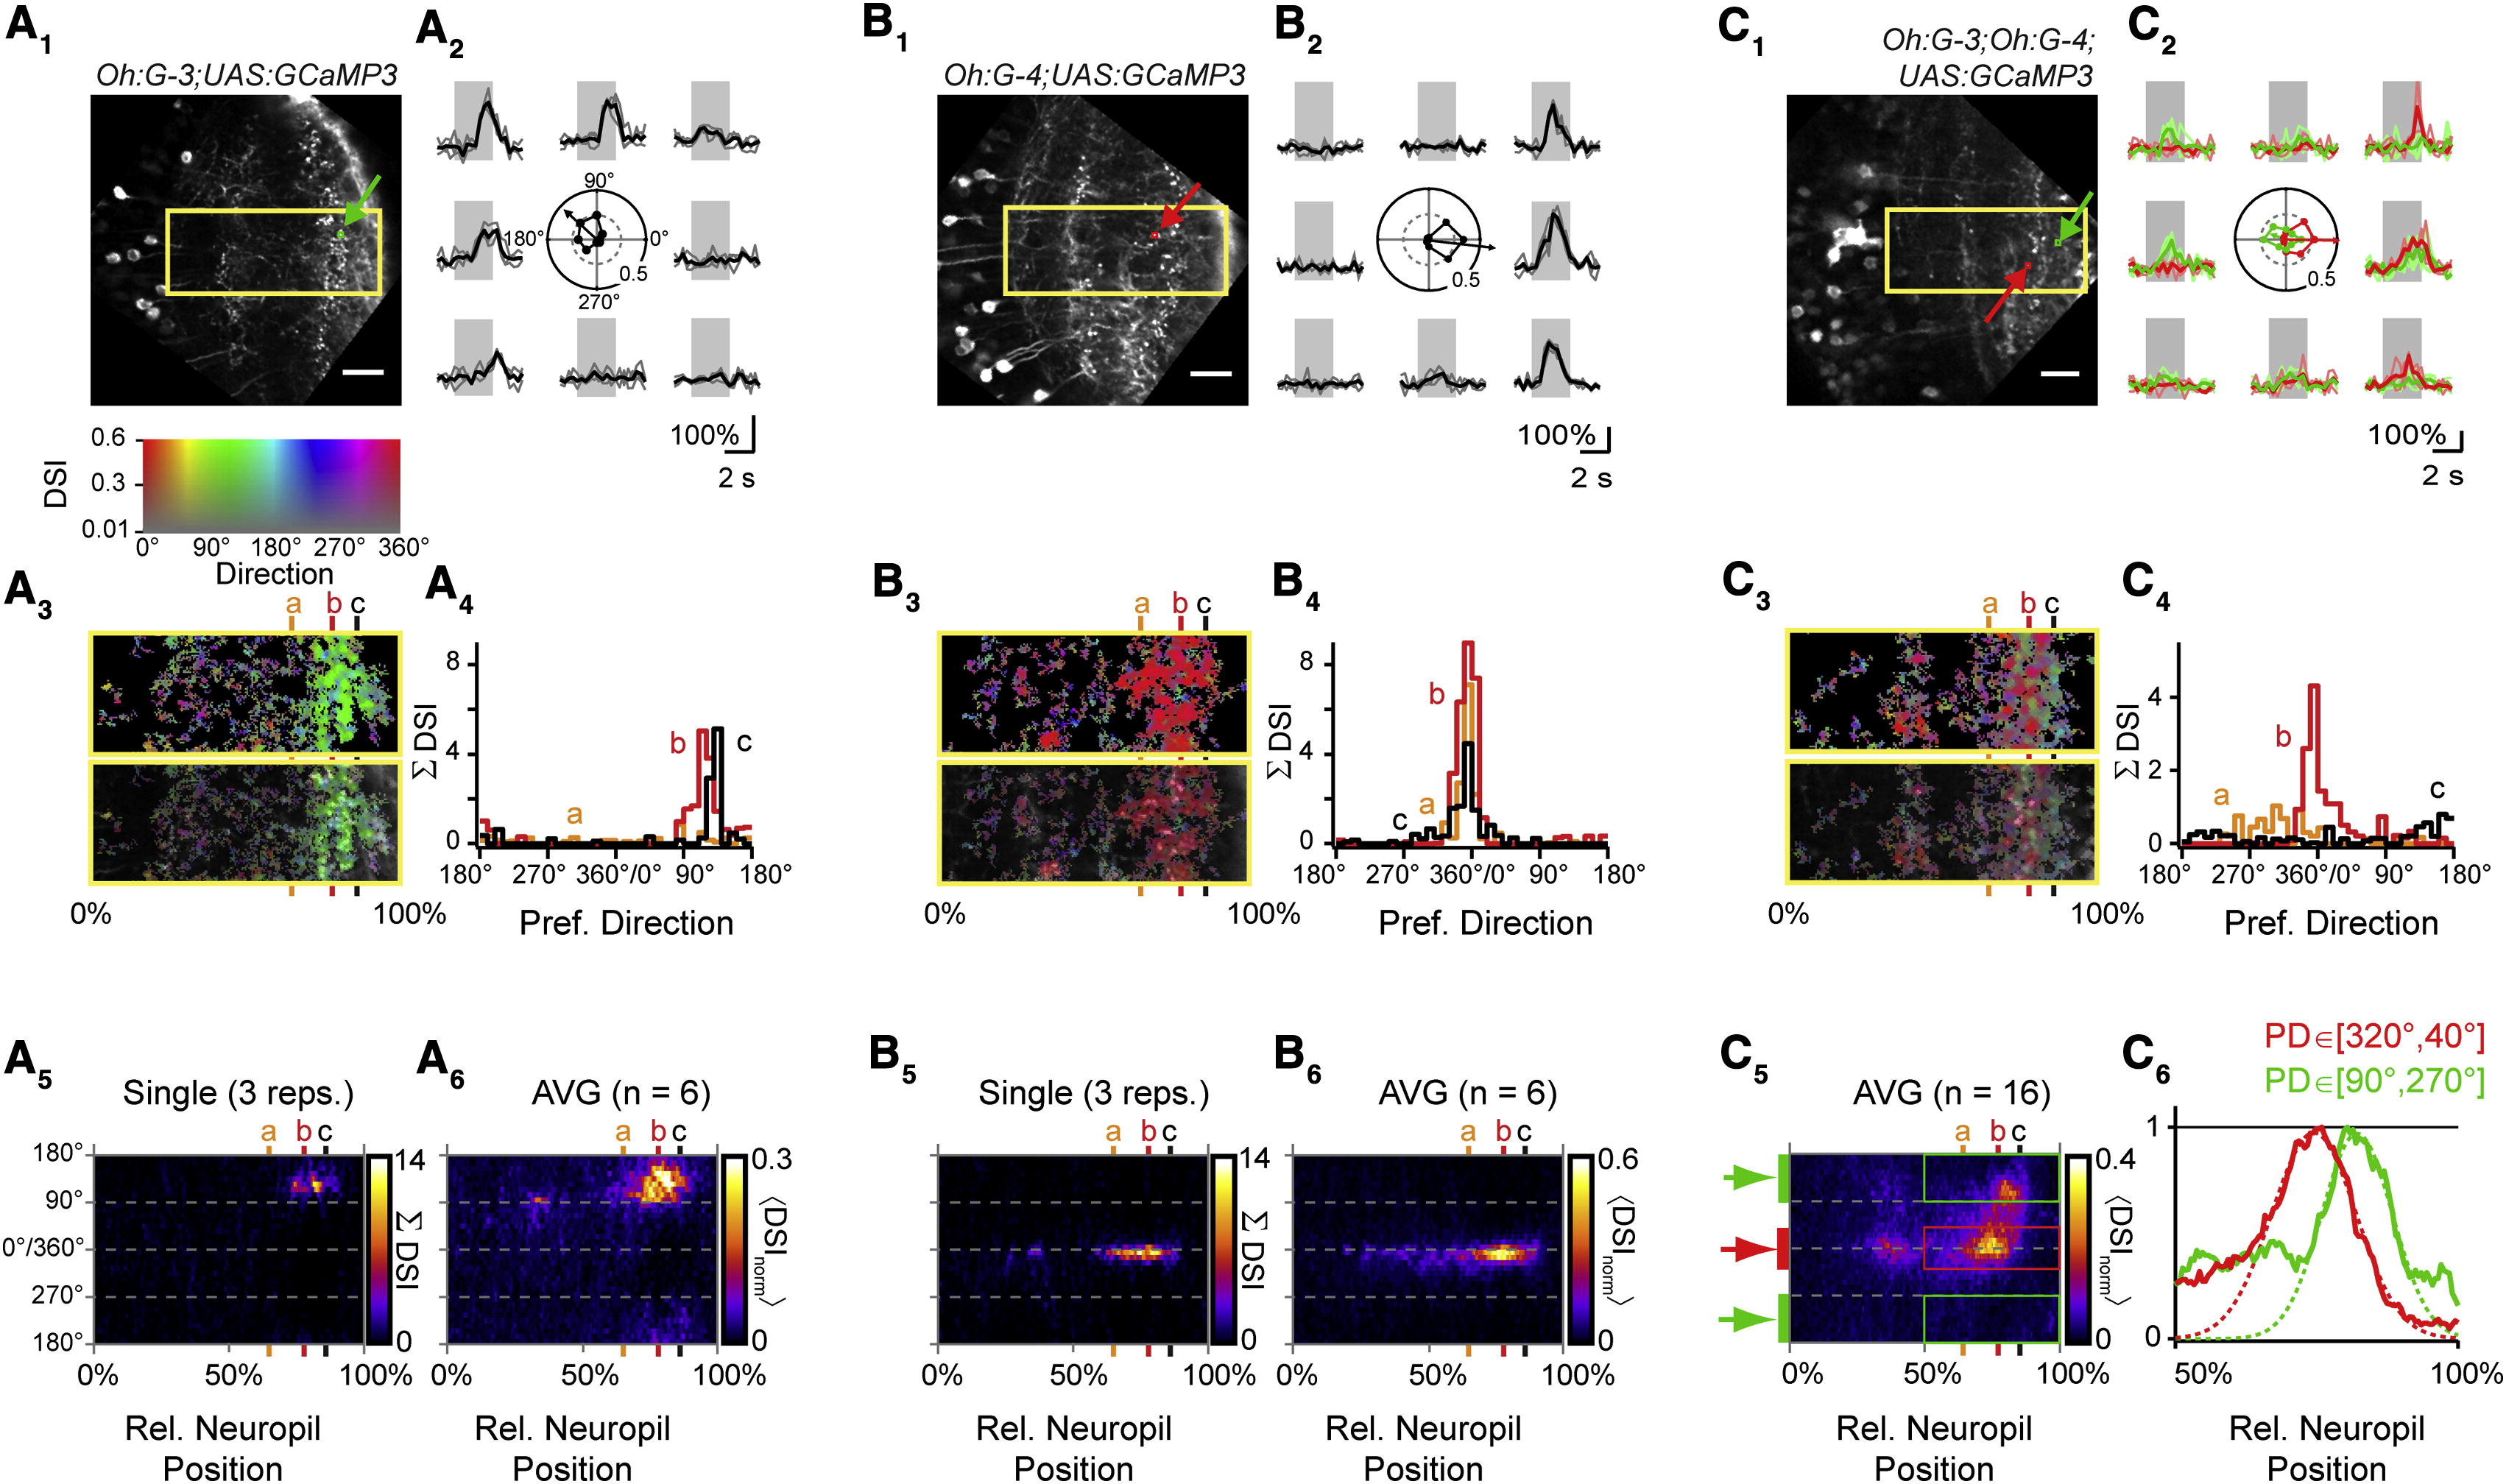
Fig. 5 Directional Tuning of Dendritic Ca2+ Transients in Distinct Classes of Tectal Neurons(A1–A6) Dendritic Ca2+ signals in the Oh:G-3 background are tuned to moving stimuli with an RC component.(A1) Optical section of neuropil in a Tg(Oh:G-3;UAS:GCaMP3) fish. Image is rotated to orient tectal layers vertically. Yellow rectangle circumscribes region shown in (A3). Small green square and arrow indicate sliding ROI to analyze local Ca2+ signals. Scale bar represents 20 µm.(A2) Ca2+ transients measured in the small green box in (A1) in response to bars moving in eight directions (grey lines, individual traces; black line, average). Center: polar plot of normalized peak amplitudes of Ca2+ transients measured in green square from (A1). Arrow shows vector sum of normalized peak amplitudes, indicating PD and DSI.(A3) Top: color map encoding local PD and DSI for rectangular region shown in (A1). Hue encodes direction, and saturation indicates DSI value (compare color table in inset). Bottom: color map overlaid with grayscale image.(A4) Histograms of local PDs in the neuropil at three levels from the SPV/neuropil boundary. Levels are indicated by vertical lines in (A3); level a, 65%; level b, 78%; level c, 86% relative distance. Histograms represent the sum of DSI values for binned PDs (bin width 10°) at a given relative distance within the neuropil.(A5) Color representation of histograms of PDs from deep (0%) to superficial (100%) boundary in the neuropil. Color encodes summed DSIs (DSI). Columns at levels a, b, and c correspond to PD histograms shown in (A4). Data are from a single trial (three repetitions of eight stimulus directions, same as A1–A4).(A6) Average of color PD histograms from six Tg(Oh:G-3;UAS:GCaMP3) fish. Individual color histograms were normalized and averaged < DSInorm >. Note a pronounced accumulation of DSI for stimuli with RC components (between 90° and 270°).(B1–B6) Same as (A1–A6) but for Tg(Oh:G-4;UAS:GCaMP3). A small sliding ROI (red square and arrow in B1) was used to calculate local PD and DSI. Note that the neuropil Ca2+ signals are substantially tuned for CR directions (0°) in the single trial (B5, same data as B1–B4) and the average PD histogram from six fish (B6).(C1) Optical section of neuropil in a triple transgenic Tg(Oh:G-3;Oh:G-4;UAS:GCaMP3) fish.(C2) Ca2+ transients measured from small boxed ROIs (red and green arrows in C1, respectively) during the same stimulus trial. Center: corresponding polar plot with normalized ”F/F amplitudes and PD, showing opposite tuning.(C3) Top: color map encoding local PD and DSI for rectangular region in (C1). Color look-up table is the same as in inset above (A3). Bottom: color map overlaid with grayscale image.(C4) Histograms of local PDs at levels a, b, and c in the neuropil in this line. Same binning method as in (A4). Different layers prefer different directions in the same trial.(C5) Color representation of PD histograms from 0% to 100% relative distance in neuropil in the Tg(Oh:G-3;Oh:G-4;UAS:GCaMP3) line. Average map from 16 optical sections in nine fish, normalized and averaged as in (A6) and (B6). Color encodes mean normalized DSIs (<DSInorm >).(C6) Intensity profiles measured between the 50% and 100% level of neuropil. Profiles were averaged for CR directions (red bar in C5, red line in C6) and for RC directions (green bars in C5, green line in C6) separately. DSI for RC directions exhibits a maximum at more superficial levels than that for CR directions (dashed lines are Gaussian fit curves).