
|
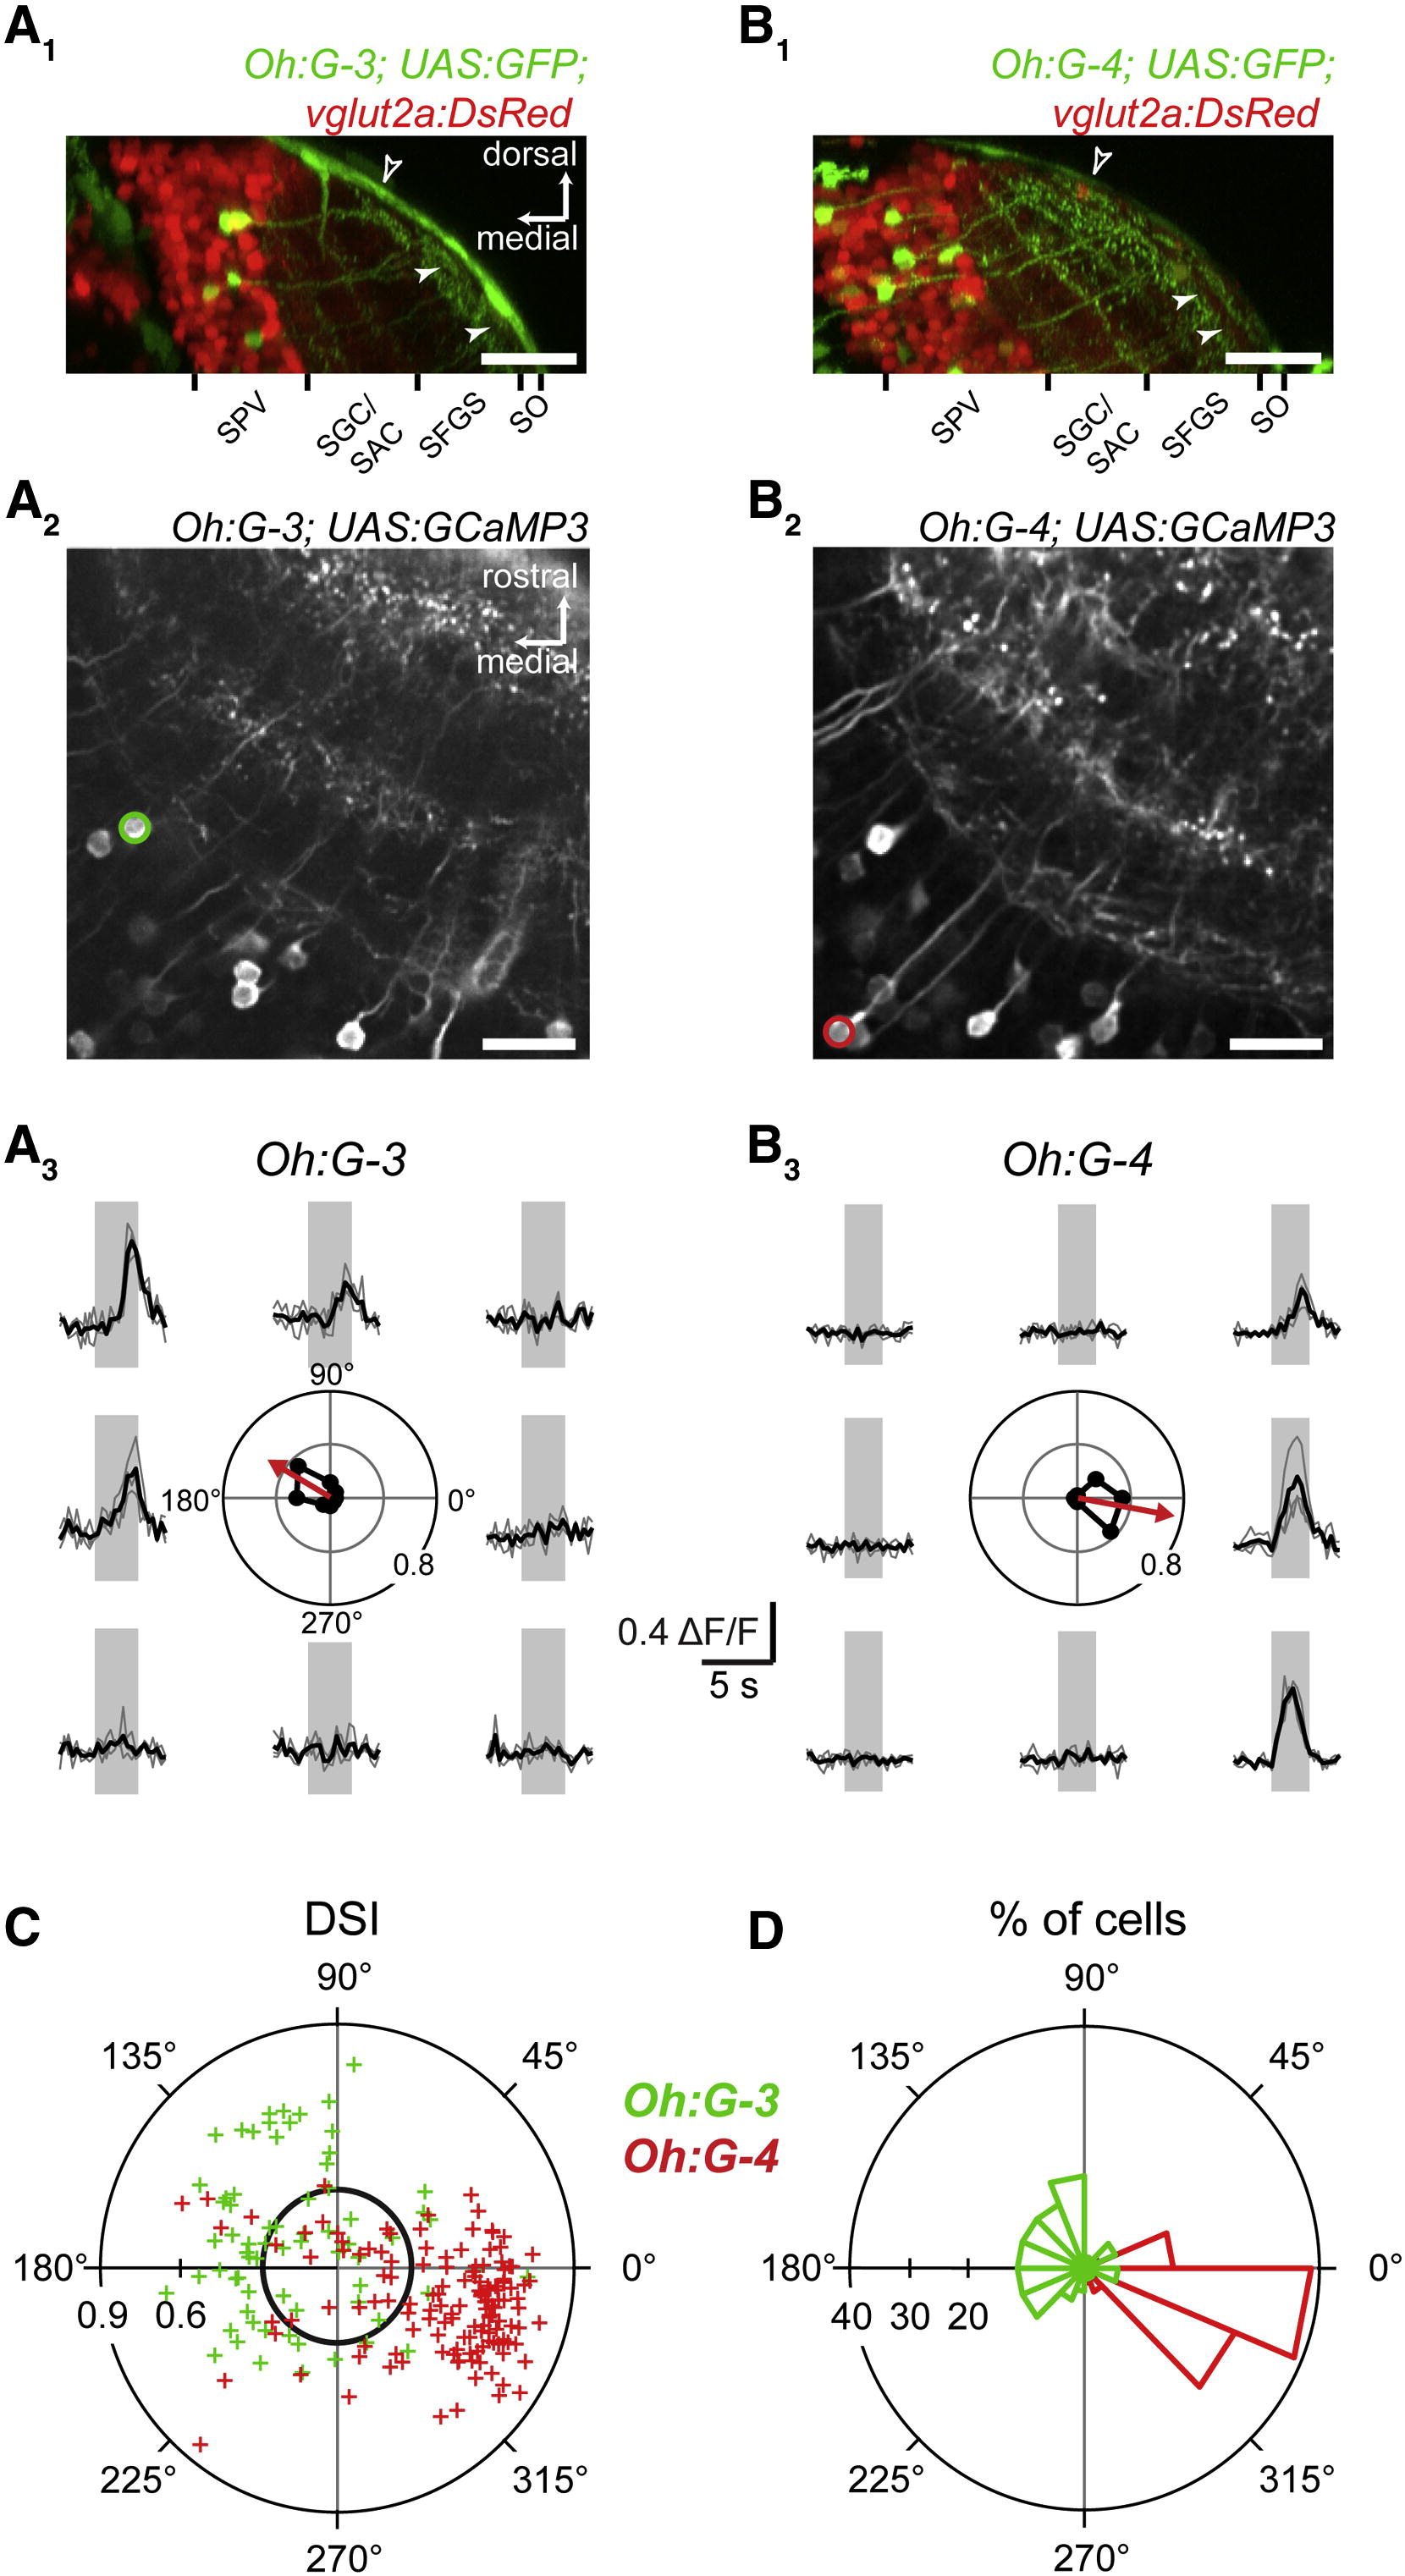
Fig. 2 Somatic GCaMP3 Ca2+ Transients in Different Tectal Cell Classes (A1) Transverse optical section from a confocal stack through the optic tectum (OT) of a Tg(Oh:G-3;UAS:GFP;vGlut2a:DsRed) larva. Filled arrowheads represent border between SFGS and SO. Open arrowhead indicates skin fluorescence. Scale bar represents 50 µm.(A2) Optical section from a Tg(Oh:G-3;UAS:GCaMP3) larva in the central region of one tectal hemisphere. Dorsal view; circle shows cell analyzed in (A3). Scale bar represents 20 µm.(A3) Somatic Ca2+ transients measured in a cell in the Tg(Oh:G-3;UAS:GCaMP3) line during presentation of bars moving in eight directions. Center: polar plot of normalized peak amplitudes (black circles) and vector sum (red arrow).(B1) Transverse optical section from a confocal stack through the OT of a Tg(Oh:G-4;UAS:GFP;vGlut2a:DsRed) larva. Filled arrowheads represent border between SFGS and SO. Open arrowhead indicates skin fluorescence. Scale bar represents 50 µm.(B2) Optical section from a Tg(Oh:G-4;UAS:GCaMP3) larva in the central region of one tectal hemisphere. Dorsal view; circle shows cell analyzed in (B3). Scale bar represents 20 µm.(B3) Same as (A3) but for somatic Ca2+ transients in the cell marked in (B2).(C) DSI and PD for cells imaged in Tg(Oh:G-3;UAS:GCaMP3) (green) and Tg(Oh:G-4;UAS:GCaMP3) (red) that showed responses to moving bars. For [Oh:G-3], a total of 112 cells were analyzed, 69 of which responded to moving bars (61.6%). For [Oh:G-4], a total of 217 cells were analyzed, 138 of which responded to moving bars (63.6%). Black circle marks a DSI of 0.3.(D) Histogram of PDs for all DS cells from (C) ([Oh:G-3]: 52 of 69 = 75.4% of responsive cells; 52 of 112 = 46.4% of all cells; [Oh:G-4]: 118 of 138 = 85.5% of responsive cells; 118 of 217 = 54.4% of all cells).