
|
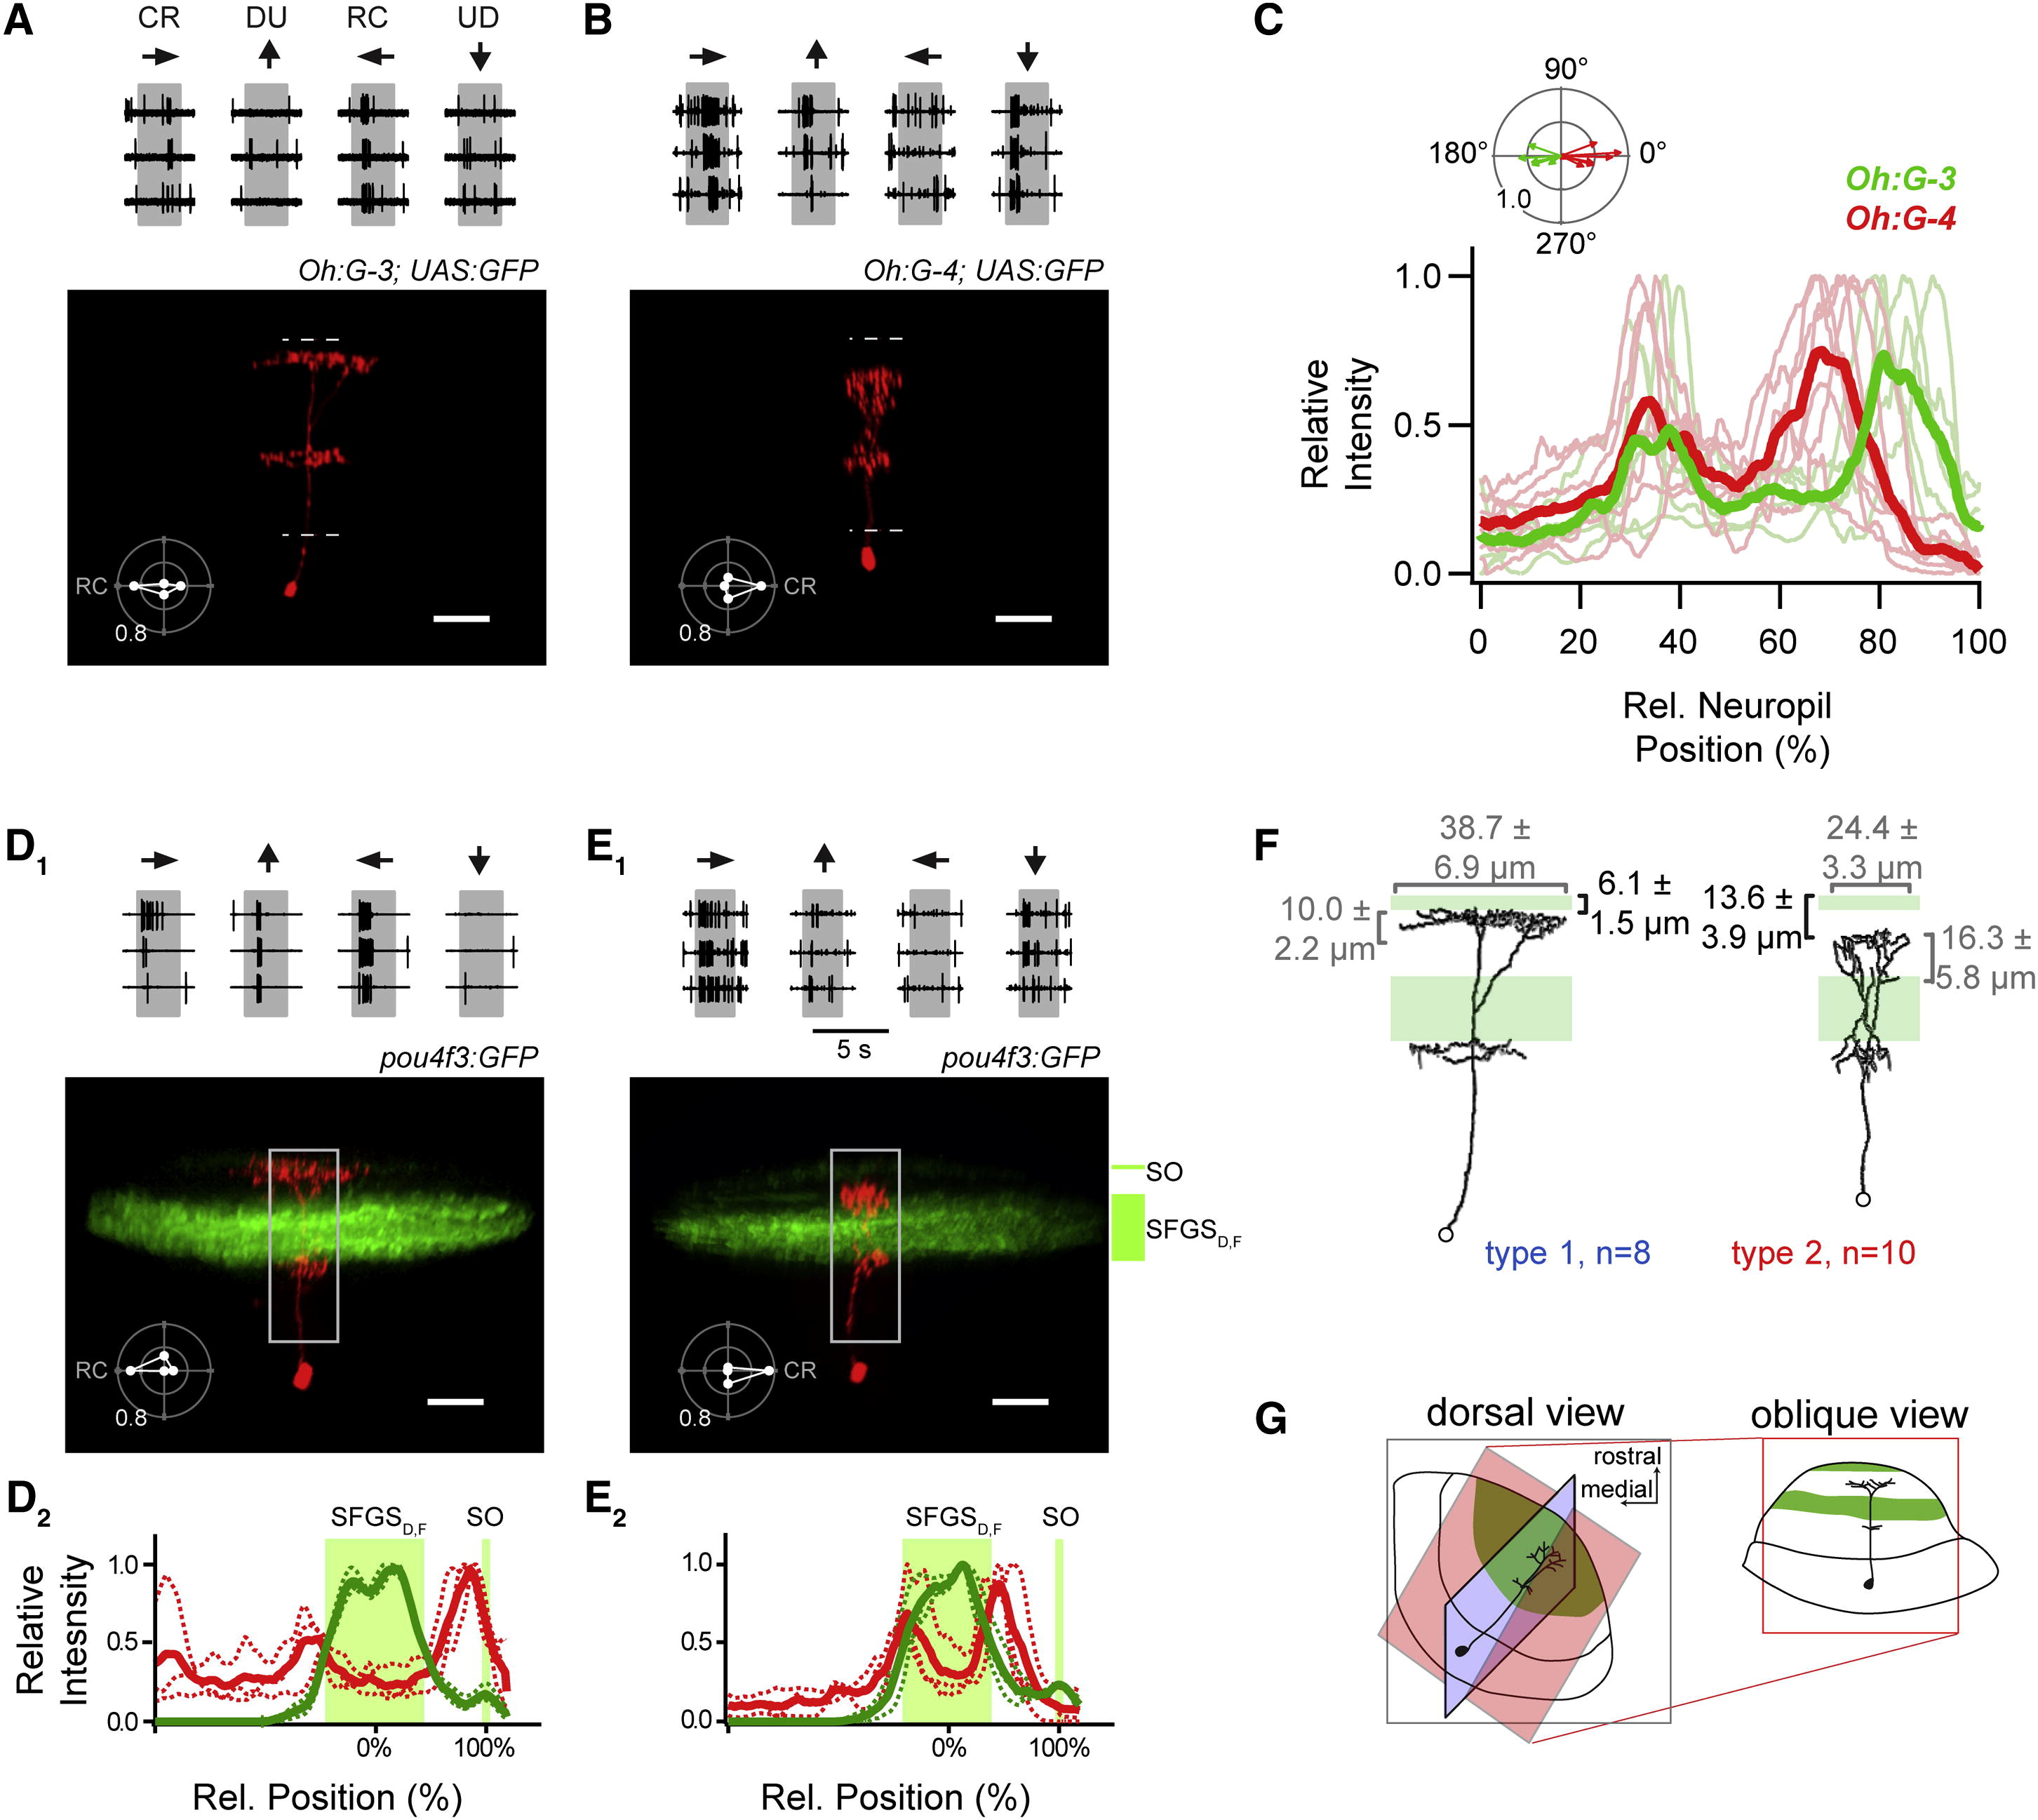
Fig. 3 Morphology of Direction-Selective Neurons(A) Top: cell-attached recording of a GFP-positive neuron in the Tg(Oh:G-3;UAS:GFP) line during moving bars in four directions (three individual traces per direction). Bottom: the same cell, after break-in, filled with sulforhodamine-B (SR-B). Maximum intensity projection is shown in an oblique view (see G). Inset: polar plot of the normalized number of spikes during moving bar stimulation, RC is PD. Dashed lines indicate neuropil boundaries. Scale bar represents 20 µm.(B) Same as (A) but for a GFP-positive neuron in the Tg(Oh:G-4;UAS:GFP) line. Polar plot of normalized number of spikes shows preference for CR moving bars (inset). Scale bar represents 20 µm. Somatic pipette in (A) and (B) was removed for clarity.(C) Fluorescence profiles of individual tectal cells in the Oh:G-3 (green) and Oh:G-4 (red) background, respectively. Thin traces represent intensity profiles of single filled cells in an oblique view (as in A and B). Zero percent corresponds to the boundary between periventricular cell body layer (SPV) and the neuropil, 100% corresponds to the dorsal surface of the neuropil (see dashed lines in A and B). Thick traces indicate average profiles (Oh:G-3, n = 5; Oh:G-4, n = 7).(D1) Top: recording of cell spiking from a randomly selected neuron in the Tg(pou4f3:GFP) line, tuned for RC moving stimuli (polar plot). Bottom: maximum intensity projection of the same cell, after break-in, filled with SR-B (red) in relation to GFP fluorescence of retinal afferent layers (green) in an oblique view. Note the thin afferent SO layer (top) and the broad SFGSD,F layers. Scale bar represents 20 µm.(D2) Fluorescence profiles of individual RC-tuned cells in the Tg(pou4f3:GFP) line (red traces) and location of retinal afferent layers (SFGSD,F, SO) in the same tecta (green traces). Thin dotted traces indicate single cell profiles (n = 3), thick traces represent average profiles. The midpoint of the SFGSD,F band and the peak of the SO band serve as calibration marks (0%, 100% relative distance, respectively).(E1) Top: same as in (D1) but for a randomly selected neuron in the Tg(pou4f3:GFP) line, tuned for CR moving stimuli. Bottom: maximum intensity projection of the same cell, after break-in, filled with SR-B (red) in relation to GFP fluorescence of retinal afferent layers (green). Scale bar represents 20 µm.(E2) Fluorescence profiles of individual CR-tuned cells in the Tg(pou4f3:GFP) line (red traces) and location of retinal afferent layers (SFGSD,F, SO). Thin dotted traces indicate single cell profiles (n = 3), thick traces represent average profiles.(F) Summary of morphological properties of DS cells. RC cells pooled from Oh:G-3 and pou4f3:GFP and CR cells pooled from Oh:G-4 and pou4f3:GFP. Reconstructions show same neurons as in (A) and (B). Numbers specify the width, thickness, and distance from dorsal surface of the top dendritic compartment (mean ± SEM).>(G) Schematic of viewing planes of cells and tectal layers shown in (A–F).