
- Title
-
The metalloproteinase inhibitor Reck is essential for zebrafish DRG development
- Authors
- Prendergast, A., Linbo, T.H., Swarts, T., Ungos, J.M., McGraw, H.F., Krispin, S., Weinstein, B.M., and Raible, D.W.
- Source
- Full text @ Development
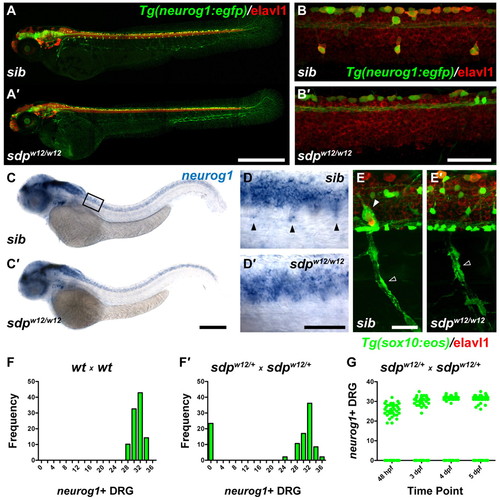
sensory-deprived (sdp) mutants exhibit a complete loss of DRG sensory neurons. (A) Tg(neurog1:egfp) zebrafish embryos (3 dpf) immunostained for Elavl1. (A2) DRG are absent in an sdpw12/w12 mutant embryo. Scale bar: 500 μm. (B,B2) High magnification images of A and A2. Scale bar: 50 μm. (C,C2) neurog1 expression at 48 hpf. Box indicates position of high magnification images in D,D2. Scale bar: 250 μm. (D,D2) High magnification image of C and C2. Scale bar: 50 μm. Arrowheads indicate neurog+ DRG sensory neuron precursors. (E,E2) Tg(sox10:eos) embryo (3 dpf) immunostained for Elavl1. Although Schwann glia (empty arrowhead) are retained, satellite glia (filled arrowhead) are absent in sdpw12/w12. Scale bar: 25 μm. (F,F2) Counts of neurog1+ DRG at 3 dpf. Approximately 25% of embryos fail to form DRG, suggesting that sdpw12 is a fully penetrant recessive mutation. (G) Counts of neurog1+ DRG followed over four days. DRG never appear in <25% of the population, indicating that sdp does not delay in DRG development. EXPRESSION / LABELING:
PHENOTYPE:
|
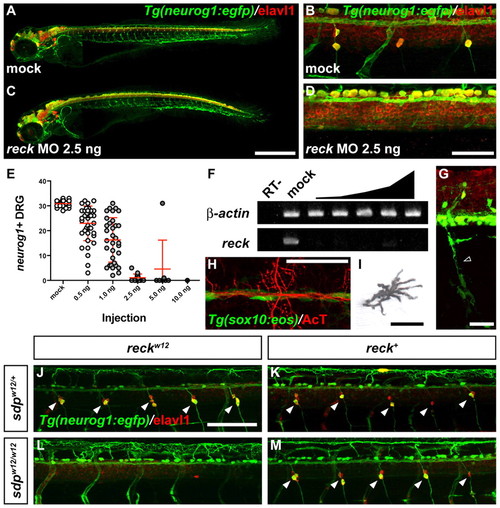
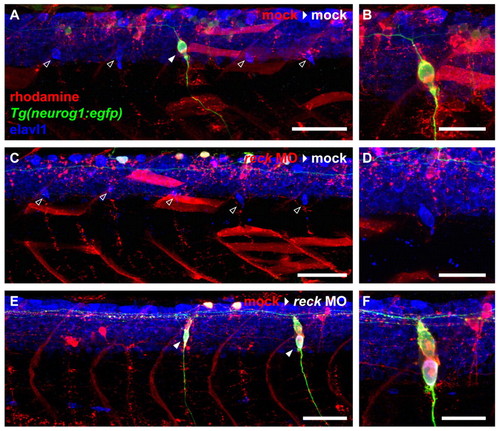
Phenocopy of sdp with reck MO and rescue by expression of wild-type reck. (A-D) Mock injected (A,B) and MO-injected (C,D) 3 dpf Tg(neurog1:egfp) embryos immunostained for Elavl1. Scale bar: 500 μm in A,C; 50 μm in B,D. (E) neurog1+ DRG at 3 dpf in embryos injected with indicated doses of reck MO. Error bars represent s.d. (F) Loss of correctly spliced reck transcript with reck MO. RT–, negative control reaction without reverse transcriptase. (G-I) Tg(sox10:eos) embryo (3 dpf) injected with 1.5 ng reck MO and immunostained for Elavl1. (G) Crest-derived Schwann glia (empty arrowhead) are retained. Scale bar: 25 μm. (H) Crest-derived lateral line glia are retained. Scale bar: 50 μm. (I) Crest-derived pigment cells (melanophore shown) are retained. Scale bar: 25 μm. (J-M) Injection of 200 pg sdpw12 reck mRNA has no effect on sdpw12/+ (J) or sdpw12/w12 (L) fish. Injection of wt reck mRNA has no effect on sdpw12/+ fish (K) but rescues DRG formation in sdpw12/w12 fish (M). Scale bar: 100 μm. Arrowheads indicate DRG neurons. EXPRESSION / LABELING:
|
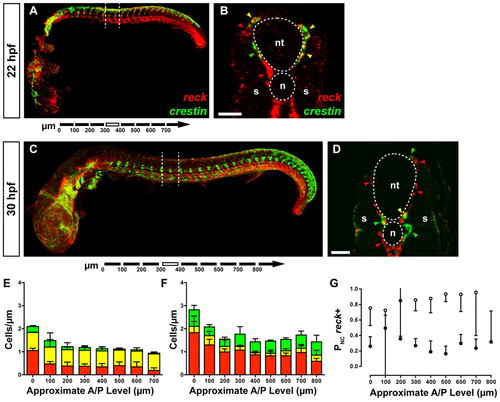
reck expression in neural crest cells. (A) Whole-mount zebrafish embryo (22 hpf). Dashed lines indicate the plane of section shown in B. (B) reck+ cells (red arrowheads) are present in both the developing vasculature and presumptive neural crest. A small number of crestin+ cells are also visible (green arrowhead). Most crestin+ cells are also reck+ (yellow arrowheads). Scale bar: 25 μm. (C) Whole-mount embryo (30 hpf). Dashed lines indicate the plane of the section shown in D. (D) Many reck+ cells (red arrowheads) are present in the developing vasculature. Many crestin+ cells (green arrowheads) are now apparent with few crestin+/reck+ cells (yellow arrowhead), suggesting the two markers have resolved into different populations. Scale bar: 25 μm. (E,F) Cell counts from serial sections of 22 hpf (E) and 30 hpf (F) embryos. Error bars represent s.d. Green, crestin+ cells; yellow, crestin+/reck+ cells; red, reck+ cells. (G) crestin+/reck+ cells as a proportion of all cells expressing crestin for 22 hpf (white circles) and 30 hpf (black circles) embryos. In most segments we observe significant segregation of crestin and reck expression. Error bars represent 95% confidence interval. n, notochord; nt, neural tube; s, somite. EXPRESSION / LABELING:
|
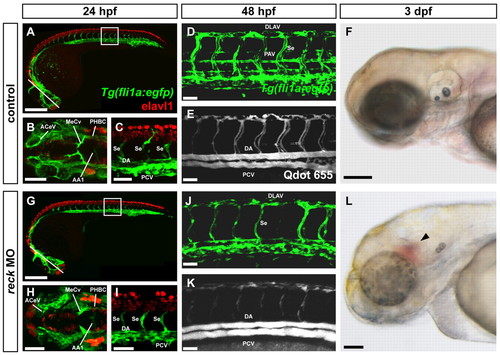
reck-deficient embryos exhibit defects in vascularization. Mock-injected (A-F) and reck MO-injected (G-L) zebrafish embryos. (A,G) Tg(fli1a:egfp) zebrafish embryo (24 hpf) immunostained for Elavl1. Line indicates plane of image in B,H; box indicates area of image in C,I. Scale bars: 250 μm. (B,H) Cranial vasculature. AA1, mandibular arch; ACeV, anterior cerebral vein; MeCV, middle cerebral vein; PHBC, primordial hindbrain channel. Scale bars: 100 μm. (C,I) Trunk vasculature. DA, dorsal aorta; PCV, posterior cardinal vein; Se, intersegmental vessel. Scale bars: 50 μm. All blood vessels form normally in MO-injected animals but are slightly delayed in their extension. (D,J) Tg(fli1a:egfp) embryo (48 hpf). DLAV, dorsal longitudinal anastomotic vessel; PAV, parachordal vessel. The PAV is reduced in size or fails to form entirely in MO-injected embryos. Scale bars: 50 μm. (E,K) Qdot angiogram of the embryo shown in D,J. Although blood flows through the DA and PCV after MO injection, blood flow is somewhat reduced in the DLAV and intersegmental vessels. Scale bars: 50 μm. (F,L) Brightfield image of 3 dpf embryo. Cranial hemorrhage (arrowhead) is visible in a significant fraction of MO-injected embryos. Scale bars: 135 μm. EXPRESSION / LABELING:
PHENOTYPE:
|
DRG defects from reck depletion are cell-autonomous. (A) Mock-injected zebrafish embryo (3 dpf) implanted with mock-injected cells. Four host-derived DRG are visible (empty arrowheads) flanking one donor-derived DRG (filled arrowhead). Scale bar: 50 μm. (B) High magnification image of the donor-derived DRG shown in A. Scale bar: 25 μm. (C) Mock-injected embryo (3 dpf) implanted with MO-injected cells. Five host-derived DRG are visible (empty arrowheads), but donor cells never give rise to DRG. Scale bar: 50 μm. (D) High magnification image of one of the host-derived DRG shown in C. Scale bar: 25 μm. (E) MO-injected embryo (3 dpf) implanted with mock-injected cells. Only donor-derived DRG (filled arrowheads) are present. Scale bar: 50 μm. (F) High magnification image of one of the donor-derived DRG shown in E. Scale bar: 25 μm. |

Alterations in migration after reck depletion. (A-F) Uninjected and MO-injected Tg(sox10:nls-eos) zebrafish embryos were imaged from 18 to 40 hpf. (A,B) Migration of reck MO-injected neural crest is generally appropriate. Scale bar: 25 μm. (C) Number of cells is not altered after MO injection. (D) Average velocity. MO-injected cells are hypermigratory compared with uninjected cells [t(92)=2.26, P=2.84E-2]. (E) Division rate is not significantly altered following reck depletion. (F) Apoptosis is a rare event and was not observed in any MO-injected embryo time-lapses (preventing statistical analysis). (G-L) To examine cell behavior during overt DRG neuronal differentiation, uninjected and MO-injected Tg(sox10:nls-eos)/Tg(neuroD:tagRFP) embryos were imaged in time-lapse from 30 to 60 hpf. (G) In uninjected embryos, a subset of the cells in the migratory stream condense just ventral to the spinal cord (bin of ±10 μm is indicated by the bracket), forming the prospective DRG (empty arrowhead). These cells will become either the initial sensory neuron or its associated satellite glia. Note that sox10+ oligodendrocytes (filled arrowheads) are visible in both conditions; they can be distinguished from neural crest by their position in the spinal cord, their spherical nuclei and their late initiation of sox10 expression. Scale bar: 25 μm. (H) Embryos injected with 1.5 ng reck MO fail to form the DRG neuroglial cluster. Other neural crest cells take up positions consistent with Schwann cells or migrate out of the field entirely. (I) Number of cells tracked per time-lapse is not different in uninjected and MO-injected embryos. (J) Average velocity. MO-injected cells are hypomigratory compared with uninjected cells [t(233)=2.79, P=5.6E-3]. (K) Division rate is not significantly altered following reck depletion. (L) MO-injected cells undergo apoptosis at a significantly greater rate than uninjected cells [t(11)=2.269, P=4.44E-2]. (M) Proportion of cells inhabiting the ±10 μm bin flanking the ventralmost extent of the spinal cord at each point in time (bracket in G,H). LLX, time point at which the lateral line crosses the imaged segment. Black, uninjected embryos; red, MO-injected embryos. Error bars are ±95% confidence interval. Significantly fewer cells localize at the ventral aspect of the spinal cord. Simple linear regression of control and MO-injected data indicates that the proportion of uninjected cells inhabiting the prospective DRG microenvironment increases over time whereas the proportion of MO-injected cells inhabiting this region decreases [F(1, 1858)=647.832, P<0.0001; control: y=2.76×10⁻³ x + 0.178; MO-injected: y=–3.46×10⁻⁴ x + 0.300]. EXPRESSION / LABELING:
PHENOTYPE:
|
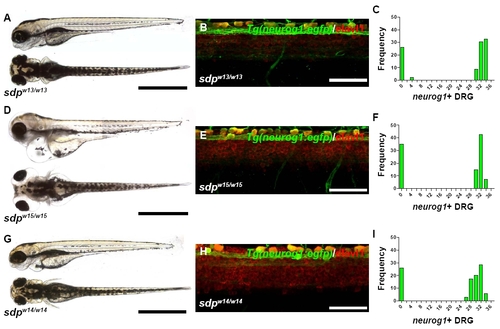
All alleles of sdp exhibit complete DRG loss. (A) sdpw13/w13 exhibits normal morphology and pigmentation. Scale bar: 500 μm. (B) A high-magnification image of 3 dpf Tg(neurog1:egfp)/sdpw13/w13 zebrafish immunostained for Elavl1 reveals no DRG neurons. Scale bar: 50 μm. (C) Approximately 25% of 3 dpf embryos from a cross between sdpw13/+ parents fail to form neurog1+ DRG, indicating that sdpw13 is a fully penetrant recessive mutation. (D) sdpw15/w15 exhibits normal pigmentation but acquires a progressively worsening edema around the eyes and heart beginning at 3 dpf. Scale bar: 500 μm. (E) A high-magnification image of 3 dpf Tg(neurog1:egfp)/sdpw15/w15 zebrafish immunostained for Elavl1 reveals no DRG neurons. Scale bar: 50 μm. (F) Approximately 25% of 3 dpf embryos from a cross between sdpw15/+ parents fail to form neurog1+ DRG, indicating that sdpw15 is a fully penetrant recessive mutation. (G) sdpw14/w14 exhibits normal morphology and pigmentation. Scale bar: 500 μm. (H) A high-magnification image of 3 dpf Tg(neurog1:egfp)/sdpw14/w14 zebrafish immunostained for Elavl1 reveals no DRG neurons. Scale bar: 50 μm. (I) Approximately 25% of 3 dpf embryos from a cross between sdpw14/+ parents fail to form neurog1+ DRG, indicating that sdpw14 is a fully penetrant recessive mutation. |
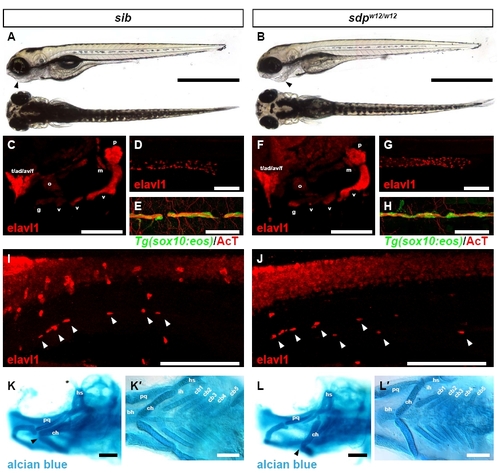
Derivatives of the neural crest other than DRG are largely unperturbed in sdp embryos. (A) Brightfield micrograph of a sibling 4 dpf zebrafish embryo. Scale bar: 500 µm. (B) Brightfield micrograph of a sdpw12/w124 dpf embryo. The sdpw12/w12 jaw is retracted (arrowhead). (C) Cranial ganglia of a sibling 4 dpf embryo as identified by Elavl1 immunostaining. ad, anterodorsal lateral line ganglion; av, anteroventral lateral line ganglion; f, facial ganglion; g, glossopharyngeal ganglion; m, middle lateral line ganglion; o, octaval/statoacoustic ganglion; p, posterior lateral line ganglion; t, trigeminal ganglion; v, vagal ganglia. Scale bar: 100 μm. (F) All cranial ganglia are present in sdpw12/w12 embryos. (D) Enteric nervous system of a sibling 5 dpf embryo as shown by Elavl1 immunostaining. Scale bar: 100 μm. (G) Enteric nervous system of a sdpw12/w125 dpf embryo. The enteric nervous system migrates the full extent of the gut. (E) Lateral line nerve of a sibling 4 dpf embryo stains positive for acetylated tubulin; myelinating glia are marked by the sox10:eos transgene. Scale bar: 50 μm. (H) Lateral line nerve and associated myelinating glia are present in sdpw12/w12 embryos. (I) Sympathetic neurons (arrowheads) in a sibling 5 dpf embryo immunostained for Elavl1. Scale bar: 150 μm. (J) Sympathetic neurons are also present in 5 dpf sdpw12/w12 embryos. Scale bar: 150 μm. (K) Head cartilages of a sibling 4 dpf embryo. Note the position of the ceratohyal cartilage (arrowhead). ch, ceratohyal; hs, hyosymplectic; pq, palatoquadrate. Scale bar: 100 μm. (K2) Branchial arches of a sibling 4 dpf embryo. bh, basihyal; cb, ceratobranchial; ih, interhyal. Scale bar: 100 μm. (L) Head cartilages of a sdpw12/w124 dpf embryo. The ceratohyal cartilage is retracted (arrowhead). Scale bar: 100 μm. (L2) All branchial arches of the sdpw12/w124 dpf embryo are present. Scale bar: 100 μm. |
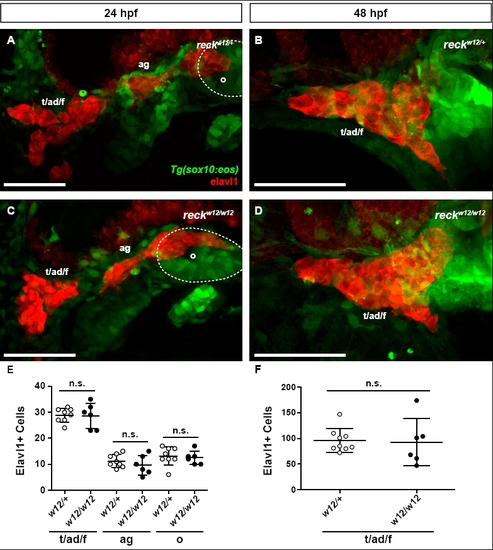
Cranial ganglia form normally in sdp embryos. (A) Tg(sox10:eos)/sdpw12/+ embryo at 24 hpf immunostained for Elavl1. ad, anterodorsal lateral line ganglion; ag, anterodorsal lateral line ganglion (Andermann et al., 2002); f, facial ganglion; o, octaval/statoacousic ganglion; t, trigeminal ganglia. Scale bar: 50 μm. (B) Tg(sox10:eos)/sdpw12/+ embryo at 48 hpf immunostained for Elavl1. Scale bar: 50 μm. (C) Tg(sox10:eos)/sdpw12/w12 embryo at 24 hpf immunostained for Elavl1. Scale bar: 50 μm. (D) Tg(sox10:eos)/sdpw12/w12 embryo at 48 hpf immunostained for Elavl1. Scale bar: 50 μm. (E) Quantification of Elavl1+ cell counts per ganglion taken from Tg(sox10:eos)/sdpw12/+ and Tg(sox10:eos)/sdpw12/w12 embryos at 24 hpf. There is no significant difference in Elavl1+ cell count between genotypes in any ganglion counted. (F) Quantification of Elavl1+ cell counts in the trigeminal/facial ganglion taken from Tg(sox10:eos)/sdpw12/+ and Tg(sox10:eos)/sdpw12/w12 embryos at 48 hpf. There is no significant difference in Elavl1+ cell count between genotypes. Error bars represent s.d. n.s., not significant. |
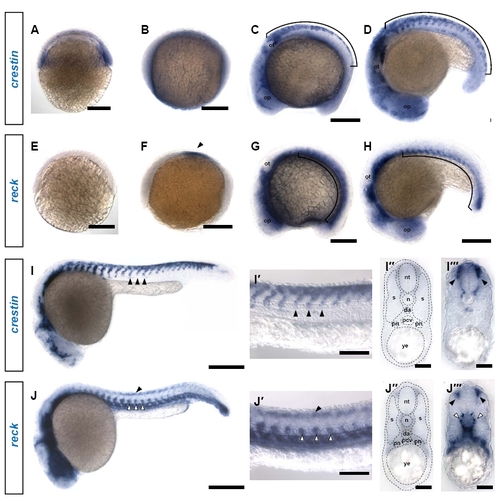
reck is expressed in vasculature and other ventral tissues throughout early development. (A) crestin expression can be detected at shield stage. Scale bar: 200 μm. (B) crestin expression is faint and diffuse at bud stage. Scale bar: 200 μm. (C) crestin is strongly expressed in a dorsal domain corresponding to the premigratory neural crest (bracket) (9 somites). op, optic placode; ot, otic placode. Scale bar: 200 μm. (D) crestin expression is maintained in the neural crest as it begins migrating in dorsoventral streams (bracket) (18 somites) Scale bar: 200 μm. (E) reck is not yet expressed at shield stage. Scale bar: 200 μm. (F) reck expression is initiated at bud stage in a bilateral patch flanking the midline (arrowhead). Scale bar: 200 μm. (G) reck expression expands to the somitic mesoderm (bracket) (9 somites) Scale bar: 200 µm. (H) reck expression remains restricted to the ventral somitic mesoderm (bracket) (18 somites) Scale bar: 200 μm. (I) At 24 hpf, crestin expression is restricted to streams of neural crest migrating ventrally (arrowheads). Scale bar: 250 μm. (I2) High magnification image of the embryo in I showing streams of migrating neural crest (arrowheads). Scale bar: 100 μm. (I22) Section through the trunk of an embryo subjected to crestin in situ hybridization; anatomical references are overlaid. da, dorsal aorta; n, notochord; nt, neural tube; pcv, posterior cardinal vein; pn, pronephros; s, somite; ye, yolk extension. (I222) In this cross-section, streams of neural crest migrating between the somite and the neural tube are defined by crestin expression (arrowheads); these ventromedially migrating cells give rise to DRG. Scale bar: 30 μm. (J) At 24 hpf, reck expression is strongest in the vasculature (white arrowheads), but a faint dorsal expression domain is also apparent (black arrowhead). Scale bar: 250 μm. (J2) High magnification image of the embryo in J showing reck expression in the ventrally situated vasculature (white arrowheads) as well as the fainter dorsal expression domain (black arrowhead). Scale bar: 100 μm. (J22) Section through the trunk of an embryo subjected to reck in situ hybridization; anatomical references are overlaid. (J222) In cross-section, reck expression is evident in both the developing vasculature (white arrowheads) and in a dorsolateral domain consistent with neural crest (black arrowheads). Scale bar: 30 μm. |
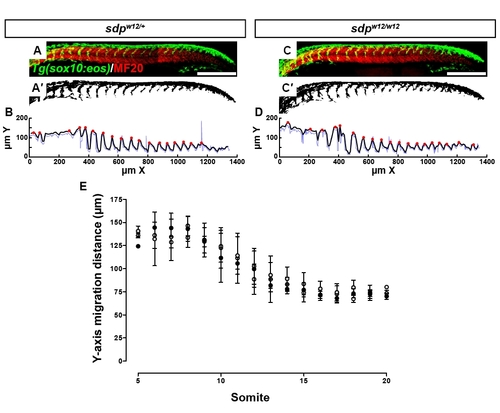
The neural crest of sdp embryos migrates to its normal extent. (A-B) Migrating streams of neural crest as seen in a 24 hpf sox10:eos transgenic background. Somites are immunostained for MF20 (A). Scale bar: 250 μm. The neural crest signal (green) was thresholded (A2) and dorsoventral migration distance was measured across the rostrocaudal axis using a MatLab algorithm (B) (blue line). The raw migration data were smoothed by averaging (black line) and local maxima were detected by iterative point-to-point comparison (red circles). (C-D) sdpw12/w12 embryos exhibit neural crest that appears to migrate the appropriate distance. (E) Neural crest migration distance at 24 hpf is indistinguishable across all three sdpw12 genotypes. White circles, sdp+/+; gray circles, sdpw12/+; black circles, sdpw12/w12. Error bars represent s.d. |
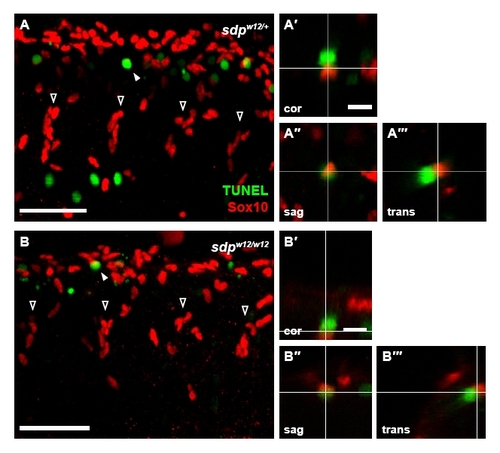
Increased apoptosis is not observed in sdp neural crest. Sdpw12/+ fish were incrossed and the resulting embryos were subjected to Sox10 and TUNEL staining at 30 hpf. Four streams of neural crest cells (open arrowheads) are visible in each image. (A) Embryos heterozygous for sdpw12 exhibit numerous TUNEL+ cells, many of which are in close proximity to Sox10+ cells (filled arrowhead). Scale bar: 50 μm. (A2-A222) Orthogonal projections of confocal stacks were generated to ascertain whether TUNEL and Sox10 staining is colocalized, as evident in the coronal (A2), sagittal (A22) and transverse (A222) projections; although TUNEL+ and Sox10+ cells are adjacent, the markers do not colocalize. Scale bar: 10 μm. (B) Embryos homozygous for sdpw12 exhibit a similar distribution of TUNEL+ and Sox10+ cells. Scale bar: 50 μm. (B2-B222) Again, in coronal (B2), sagittal (B22) and transverse (B222) projections, no colocalization of markers is observed. Scale bar: 10 μm. |
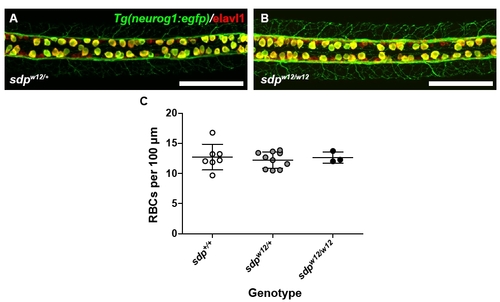
Abnormal Notch signaling does not appear to be the mechanism by which DRG fail to form in the sdp mutant. (A) Rohon-Béard cells in a 24 hpf sdpw12/+ embryo carrying the neurog1:egfp transgene (green) and immunostained for Elavl1 (red). Scale bar: 100 μm. (B) Rohon-Béard cells are present in comparable density in sdpw12/w12 embryos. Scale bar: 100 µm. (C) Counts of Rohon-Béard cells in all three sdp genotypes; Rohon-Béard cell count does not vary significantly across genotypes, F(2, 17)=0.1940, P=0.8255. |