
|
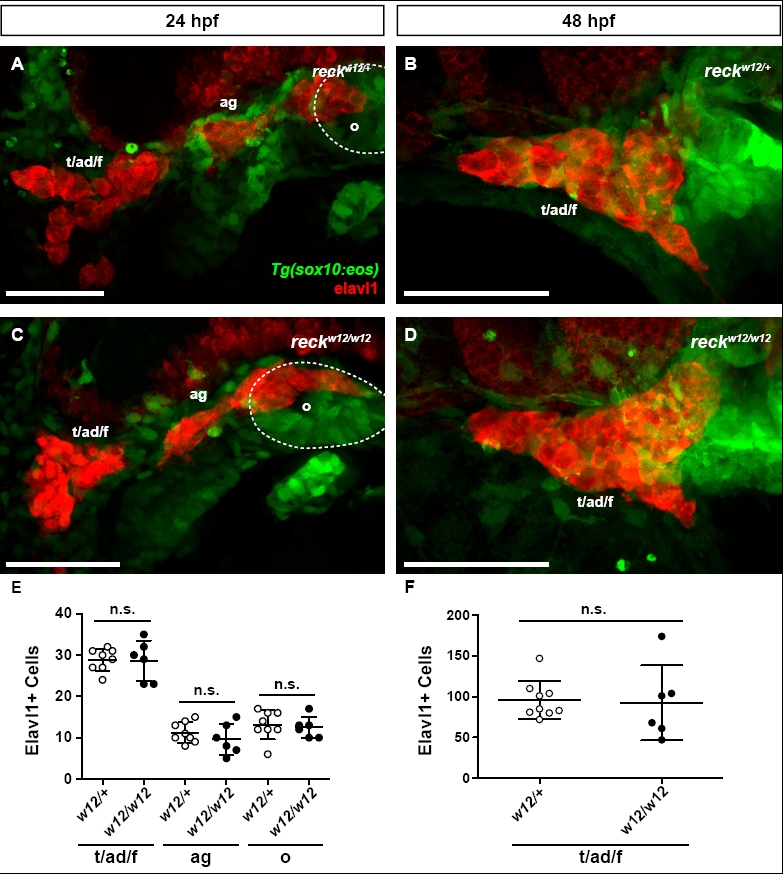
Fig. S3
Cranial ganglia form normally in sdp embryos. (A) Tg(sox10:eos)/sdpw12/+ embryo at 24 hpf immunostained for Elavl1. ad, anterodorsal lateral line ganglion; ag, anterodorsal lateral line ganglion (Andermann et al., 2002); f, facial ganglion; o, octaval/statoacousic ganglion; t, trigeminal ganglia. Scale bar: 50 μm. (B) Tg(sox10:eos)/sdpw12/+ embryo at 48 hpf immunostained for Elavl1. Scale bar: 50 μm. (C) Tg(sox10:eos)/sdpw12/w12 embryo at 24 hpf immunostained for Elavl1. Scale bar: 50 μm. (D) Tg(sox10:eos)/sdpw12/w12 embryo at 48 hpf immunostained for Elavl1. Scale bar: 50 μm. (E) Quantification of Elavl1+ cell counts per ganglion taken from Tg(sox10:eos)/sdpw12/+ and Tg(sox10:eos)/sdpw12/w12 embryos at 24 hpf. There is no significant difference in Elavl1+ cell count between genotypes in any ganglion counted. (F) Quantification of Elavl1+ cell counts in the trigeminal/facial ganglion taken from Tg(sox10:eos)/sdpw12/+ and Tg(sox10:eos)/sdpw12/w12 embryos at 48 hpf. There is no significant difference in Elavl1+ cell count between genotypes. Error bars represent s.d. n.s., not significant.