
|
Fig. 7
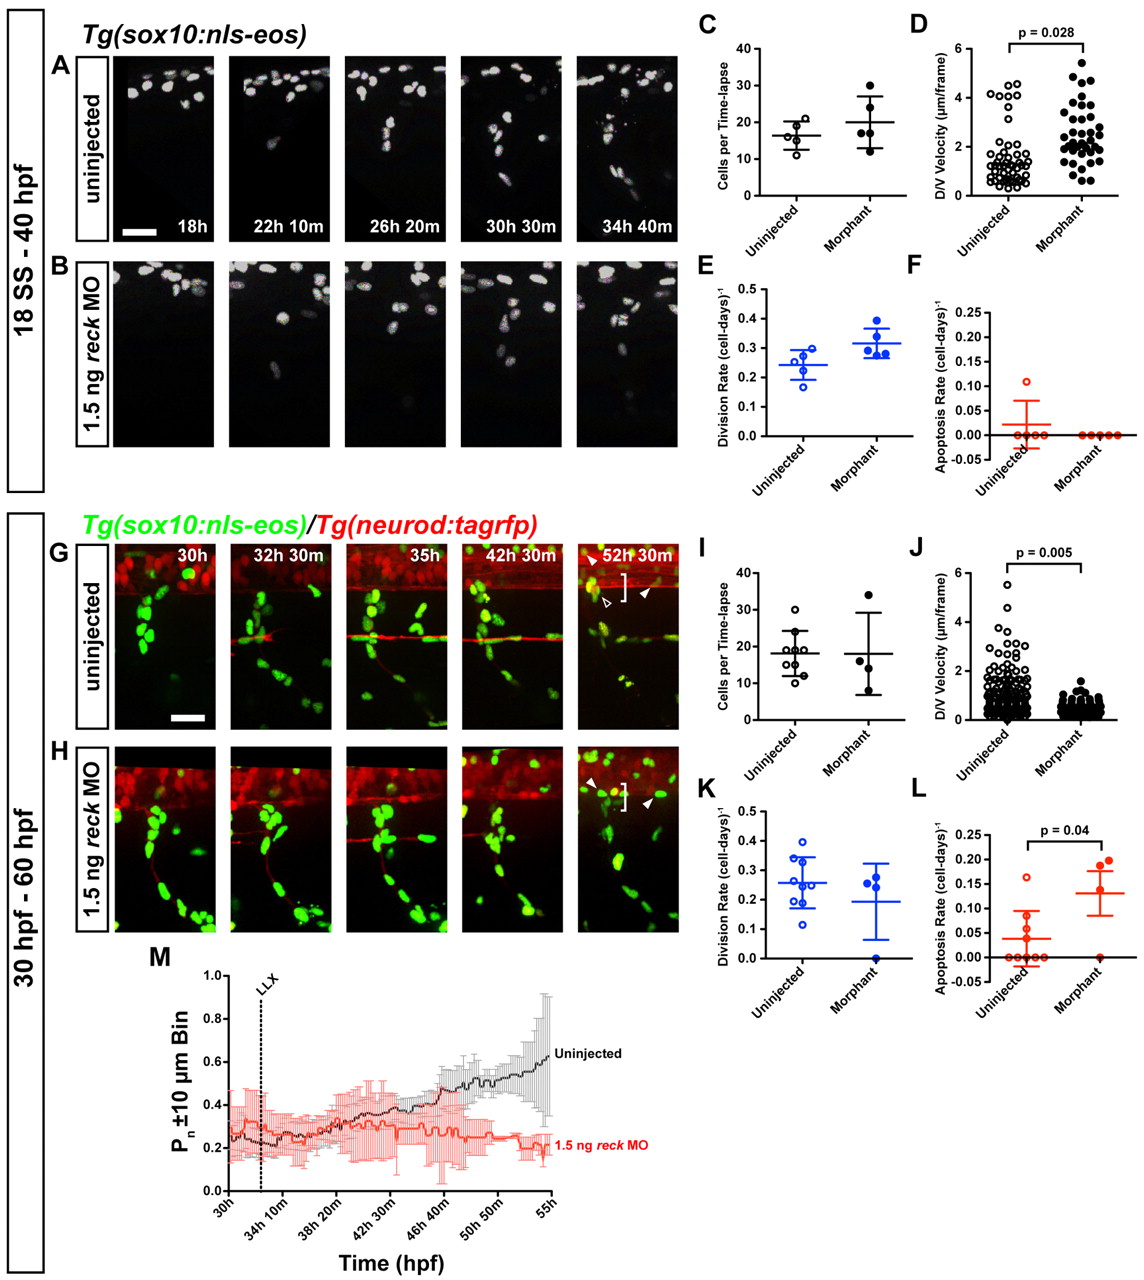
Alterations in migration after reck depletion. (A-F) Uninjected and MO-injected Tg(sox10:nls-eos) zebrafish embryos were imaged from 18 to 40 hpf. (A,B) Migration of reck MO-injected neural crest is generally appropriate. Scale bar: 25 μm. (C) Number of cells is not altered after MO injection. (D) Average velocity. MO-injected cells are hypermigratory compared with uninjected cells [t(92)=2.26, P=2.84E-2]. (E) Division rate is not significantly altered following reck depletion. (F) Apoptosis is a rare event and was not observed in any MO-injected embryo time-lapses (preventing statistical analysis). (G-L) To examine cell behavior during overt DRG neuronal differentiation, uninjected and MO-injected Tg(sox10:nls-eos)/Tg(neuroD:tagRFP) embryos were imaged in time-lapse from 30 to 60 hpf. (G) In uninjected embryos, a subset of the cells in the migratory stream condense just ventral to the spinal cord (bin of ±10 μm is indicated by the bracket), forming the prospective DRG (empty arrowhead). These cells will become either the initial sensory neuron or its associated satellite glia. Note that sox10+ oligodendrocytes (filled arrowheads) are visible in both conditions; they can be distinguished from neural crest by their position in the spinal cord, their spherical nuclei and their late initiation of sox10 expression. Scale bar: 25 μm. (H) Embryos injected with 1.5 ng reck MO fail to form the DRG neuroglial cluster. Other neural crest cells take up positions consistent with Schwann cells or migrate out of the field entirely. (I) Number of cells tracked per time-lapse is not different in uninjected and MO-injected embryos. (J) Average velocity. MO-injected cells are hypomigratory compared with uninjected cells [t(233)=2.79, P=5.6E-3]. (K) Division rate is not significantly altered following reck depletion. (L) MO-injected cells undergo apoptosis at a significantly greater rate than uninjected cells [t(11)=2.269, P=4.44E-2]. (M) Proportion of cells inhabiting the ±10 μm bin flanking the ventralmost extent of the spinal cord at each point in time (bracket in G,H). LLX, time point at which the lateral line crosses the imaged segment. Black, uninjected embryos; red, MO-injected embryos. Error bars are ±95% confidence interval. Significantly fewer cells localize at the ventral aspect of the spinal cord. Simple linear regression of control and MO-injected data indicates that the proportion of uninjected cells inhabiting the prospective DRG microenvironment increases over time whereas the proportion of MO-injected cells inhabiting this region decreases [F(1, 1858)=647.832, P<0.0001; control: y=2.76×10⁻³ x + 0.178; MO-injected: y=–3.46×10⁻⁴ x + 0.300].