
Fig. 7
- ID
- ZDB-FIG-190628-30
- Publication
- Giovannone et al., 2019 - Programmed conversion of hypertrophic chondrocytes into osteoblasts and marrow adipocytes within zebrafish bones
- Other Figures
- All Figure Page
- Back to All Figure Page
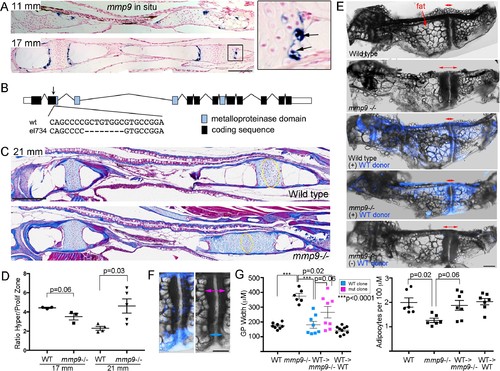
Tissue-autonomous requirement for mmp9 in cartilage remodeling.(A) Colorimetric mRNA in situ hybridization shows expression of mmp9 (blue) in sections of the Ch at 11 and 17 mm SL. Inset shows specific expression of mmp9 in hypertrophic chondrocytes (arrows) at the edge of the growth plate. Nuclear fast red was used as a counterstain. n = 2 at each stage. (B) Schematic of the mmp9 gene locus in zebrafish. Rectangles denote exons. The site of the 8 bp deletion in the el734 allele is indicated by an arrow, with specific sequence changes shown below. This frame-shift mutation is predicted to result in an early stop codon and loss of the catalytic metalloproteinase domain. (C) Trichrome staining at 21 mm SL shows enlarged growth plates in the Ch bones of mmp9 mutants. The approximate regions of the proliferative zones used for quantification in (D) are shown by the yellow ovals. (D) Quantification of the ratio of the hypertrophic to the proliferative zones shows a delay in remodeling the hypertrophic zone in mmp9 mutants at 21 but not 17 mm SL. We performed a students t-test and show standard error of the mean. (E,F) Dissected Ch bones at adult stages (27–31 mm SL) from wild-type, mmp9 mutant, and wild-type and mutant hosts receiving wild-type donor neural crest transplants (blue). Ectoderm cells from bactin2:tagBFP >DsRed donors were transplanted unilaterally into the neural crest precursor domain of unlabeled hosts at six hpf. Red two-sided arrows indicate the width of the posterior growth plates. (+) denotes sides receiving transplants, and (-) denotes contralateral control sides. The rescued growth plate from the mmp9 mutant receiving a wild-type neural crest transplant is shown at higher magnification in (F), with blue arrows showing a narrower wild-type growth plate clone and magenta arrows a wider mutant clone. (G) Quantification shows that mmp9 mutants have wider growth plates and fewer adipocytes in the marrow than wild-type siblings. Wild-type neural crest transplants rescue growth plate width in mmp9mutants, with a trend toward better rescue in areas of the growth plate with wild-type (blue) versus mutant (magenta) clones. There was also a strong trend toward rescue of adipocyte number with wild-type neural crest transplants that contributed to growth plate chondrocytes. We performed a Tukey-Kramer HSD test and show standard error of the mean. Unless indicated, all other comparisons were not significant (p > 0.05). Scale bars = 50 μm (A,C), 200 μm (E, F). See also Figure 7—source data 1. |
| Gene: | |
|---|---|
| Fish: | |
| Anatomical Term: | |
| Stage Range: | Days 30-44 to Days 45-89 |