
Fig. 1
- ID
- ZDB-FIG-190628-18
- Publication
- Giovannone et al., 2019 - Programmed conversion of hypertrophic chondrocytes into osteoblasts and marrow adipocytes within zebrafish bones
- Other Figures
- All Figure Page
- Back to All Figure Page
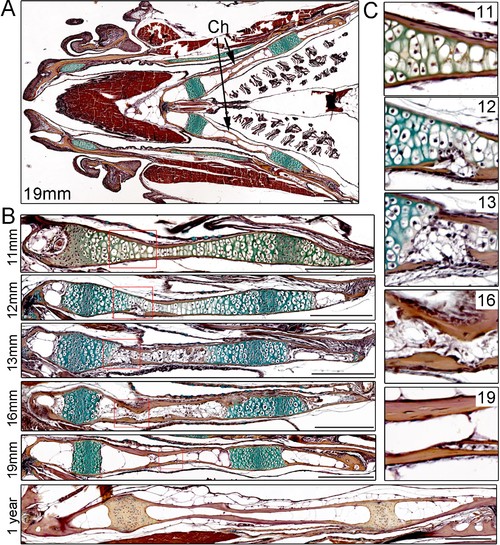
Time-course of Ch remodeling in juvenile zebrafish.(A) Pentachrome staining of a longitudinal section through the head of a 19 mm fish. The jaw is toward the left (anterior) and the gills toward the right (posterior). The green stain highlights the collagen matrix of cartilage, and the reddish-brown stain the mineralized matrix of bone. The bilateral set of Ch bones is indicated. n = 3. (B) High magnification views of the Ch at successive stages show the gradual replacement of chondrocytes in the central shaft and at each end with adipocytes (which appear white due to loss of lipid during processing). n = 3 for each stage. (C) Higher magnification views of the boxed regions in (B). Cortical bone appears reddish-brown. Note the breaks in cortical bone toward the lower part of the images at 12 and 13 mm, which are largely resolved by 16 and 19 mm. Scale bars = 50 μM. |