
Fig. 5
- ID
- ZDB-FIG-190628-26
- Publication
- Giovannone et al., 2019 - Programmed conversion of hypertrophic chondrocytes into osteoblasts and marrow adipocytes within zebrafish bones
- Other Figures
- All Figure Page
- Back to All Figure Page
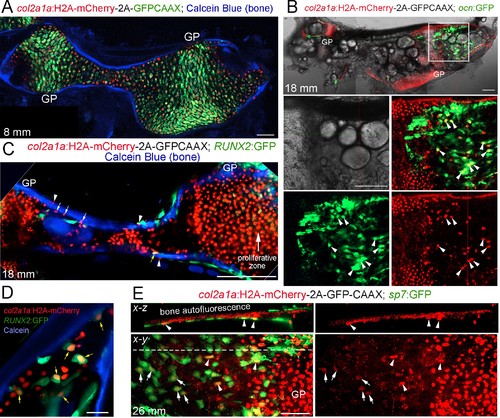
Tracing of col2a1a-lineage cells by a long-lived Histone2A-mCherry fusion protein.(A) At a stage preceding growth plate remodeling (8 mm SL), col2a1a:H2A-mCherry-2A-GFPCAAX labels chondrocytes, but not osteoblasts associated with Calcein Blue+ mineralized bone.rowth plate (GP) chondrocytes co-express the nuclear Histone2A-mCherry protein (red) and the membrane-localized GFPCAAX protein (green). In the middle and poles of Ch, hypertrophic chondrocytes retain the long-lived H2A-mCherry protein but not the short-lived GFPCAAX protein, reflective of the down-regulation of col2a1a expression during hypertrophic maturation. n = 3. (B) In a confocal section through the dissected Ch of a juvenile fish (18 mm SL), numerous H2A-mCherry+; ocn:GFP+ cells are seen in regions where the cartilage template is being converted to fat. Magnification of the boxed region shows the brightfield image (white), a merged image of H2A-mCherry+ cells (red) and ocn:GFP+ cells (green), and individual channels below. We observed a number of H2A-mCherry+; ocn:GFP+ cells (arrowheads) in 4/4 animals. (C) Confocal projection of a dissected Ch at 18 mm SL reveals cells expressing nuclear Histone2A-mCherry (red) on both the endosteal surface (arrows) and periosteal surface (arrowheads) of Calcein Blue+ cortical bone. Some H2A-mCherry+ cells associated with bone also co-express the osteoprogenitor marker RUNX2:GFP (yellow arrow). Note that the membrane GFPCAAX signal from the col2a1a:H2A-mCherry-2A-GFPCAAX transgene is much weaker and barely detectable in the proliferative zone at the gain settings used to image cytoplasmic RUNX2:GFP. n = 3. (D) Confocal section through the Ch at higher magnification shows several H2A-mCherry+; RUNX2:GFP+ cells (yellow arrows) in the marrow cavity and close to the endosteal surface of the Calcein Blue+ bone. (E) In adult fish (26 mm SL), several H2A-mCherry+ cells are found to co-express the osteoblast marker sp7:GFP on the endosteal surface. H2A-mCherry tends to be stronger closer to the growth plate; arrowheads denote stronger and arrows denote weaker H2A-mCherry signal. The white dotted line in the x-y section shows the location of the x-z section above. n = 5. Scale bars = 50 μm (A,D,E), 100 μm (B,C). |
| Genes: | |
|---|---|
| Fish: | |
| Condition: | |
| Anatomical Terms: | |
| Stage Range: | Days 21-29 to Adult |