
Fig. 6-S1
- ID
- ZDB-FIG-190628-29
- Publication
- Giovannone et al., 2019 - Programmed conversion of hypertrophic chondrocytes into osteoblasts and marrow adipocytes within zebrafish bones
- Other Figures
- All Figure Page
- Back to All Figure Page
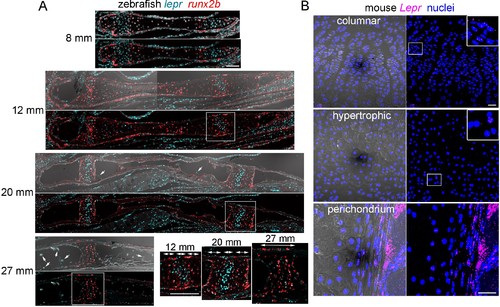
Expression of Lepr/lepr mRNA in zebrafish and mouse endochondral bone.(A) Sections through the Ch bone were processed for RNAscope in situ hybridization using probes against lepr (blue) and the hypertrophic chondrocyte and osteoblast marker runx2b (red). Images with DIC are shown above. Arrows indicate lepr +cells in the marrow. Magnifications corresponding to the boxed regions show runx2b+ hypertrophic zones flanking a central lepr+ proliferative zone within the growth plate (bidirectional arrows indicate zones). By 27 mm, a distinct lepr+ proliferative zone is no longer apparent. n = 3 for each stage. (B) Sections through the femur in 8 week old mice were processed for RNAscope in situ hybridization using a LepR probe (magenta), and counterstained with Hoechst to label nuclei (blue). Magnified regions of the growth plate show broader expression in columnar chondrocytes and only rare expression in the hypertrophic zone. Strong LepR expression is also seen within and near the perichondrium. Comparable LepR expression was observed in sections from three independent femurs. Scale bars = 50 μm. |