
Fig. 5-S1
- ID
- ZDB-FIG-190628-27
- Publication
- Giovannone et al., 2019 - Programmed conversion of hypertrophic chondrocytes into osteoblasts and marrow adipocytes within zebrafish bones
- Other Figures
- All Figure Page
- Back to All Figure Page
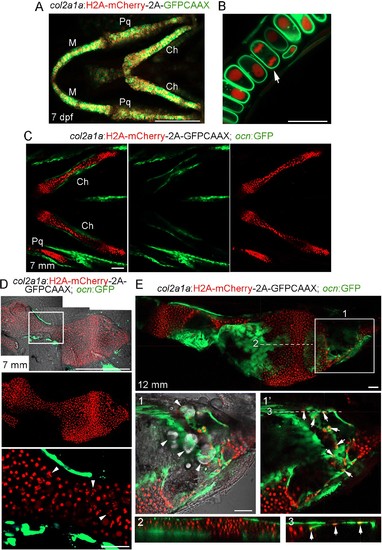
Characterization of the col2a1a:Histone2A-mCherry-2A-GFPCAAX line.(A) Confocal projection from a ventral view shows that the majority of chondrocytes co-express nuclear H2A-mCherry (red) and membrane GFPCAAX (green) in the facial cartilages of col2a1a:H2A-mCherry-2A-GFPCAAX fish at seven dpf. Note the lack of fluorescent signal outside cartilage, demonstrating specificity. M, lower jaw Meckel’s cartilage; Pq, upper jaw palatoquadrate cartilage; Ch, ceratohyal cartilage. n = 10. (B) Magnified confocal section of a region of the M cartilage from (A) shows membrane localization of GFPCAAX (green) and nuclear localization of H2A-mCherry (red). The arrow depicts a chondrocyte in anaphase. (C) Confocal projection shows the bilateral set of Ch cartilages in col2a1a:H2A-mCherry-2A-GFPCAAX; ocn:GFP fish at 7 mm SL. Merged and individual channels show that H2A-mCherry labels chondrocytes but not ocn:GFP+ osteoblasts. The much weaker GFPCAAX signal is not apparent at the lower gain used to image ocn:GFP expression. n = 2. Scale bars = 100 μm. (D) Dissected Ch cartilage from (C) shows lack of H2A-mCherry expression in ocn:GFP+ osteoblasts in the bone collar at this stage (prior to growth plate remodeling). The boxed region is magnified below. Note the nuclear fragmentation (arrowheads) in several hypertrophic chondrocytes at this stage, suggesting that some hypertrophic chondrocytes may already be initiating a cell death program. n = 2. (E) Confocal section of a dissected Ch cartilage from a col2a1a:H2A-mCherry-2A-GFPCAAX; ocn:GFP fish at the beginning of growth plate remodeling (12 mm SL). Magnification of the boxed region (1) shows a merged image of H2A-mCherry+ cells (red), ocn:GFP+ cells (green), and the DIC channel (white). Note several lipid-filled adipocytes (arrowheads) within the distal end of the Ch bone. Removal of the DIC channel (1’) reveals several H2A-mCherry+; ocn:GFP+ cells (arrows), with a corresponding digital section through the X-Z plane (3) revealing that these double-positive cells reside on the bone surface and thus likely represent osteoblasts. In contrast, an X-Z digital section through the central shaft of the Ch bone (2) shows no double-positive cells on the cortical surface, consistent with this portion of the growth plate having not yet initiated remodeling and hence lacking chondrocyte-derived osteoblasts. n = 2. Scale bars = 50 μm (A,C,E), 20 μm (B,D). |