
Fig. 3-S1
- ID
- ZDB-FIG-190628-22
- Publication
- Giovannone et al., 2019 - Programmed conversion of hypertrophic chondrocytes into osteoblasts and marrow adipocytes within zebrafish bones
- Other Figures
- All Figure Page
- Back to All Figure Page
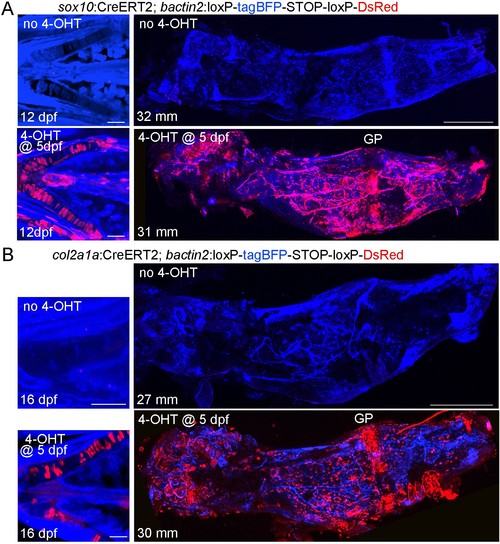
Characterization of the sox10:CreERT2 and col2a1a:CreERT2 transgenic lines.(A) Confocal projections of sox10:CreERT2; bactin2:loxP-tagBFP-stop-loxP-DsRed animals treated with or without 4-OHT at five dpf. At 12 dpf, labeling (red) is seen in Ch chondrocytes and some additional cells in the face. In the adult dissected Ch (31–32 mm SL), labeling is seen in the growth plate (GP) and throughout the bone. No labeling is seen in the absence of 4-OHT. n = 4 for each treatment. (B) Confocal projections of col2a1a:CreERT2; bactin2:loxP-tagBFP-stop-loxP-DsRed animals treated with or without 4-OHT at five dpf and then re-imaged. At 16 dpf, labeling (red) is seen only in chondrocytes (shown here for the Ch cartilages). In the adult dissected Ch (27–30 mm SL), labeling is seen in growth plate cartilage and throughout the Ch bone. No labeling is seen in the absence of 4-OHT. n = 4 for each treatment.. Scale bars = 50 μm (12–16 dpf), 400 μm (adults). |