
Fig. 2
- ID
- ZDB-FIG-190628-21
- Publication
- Giovannone et al., 2019 - Programmed conversion of hypertrophic chondrocytes into osteoblasts and marrow adipocytes within zebrafish bones
- Other Figures
- All Figure Page
- Back to All Figure Page
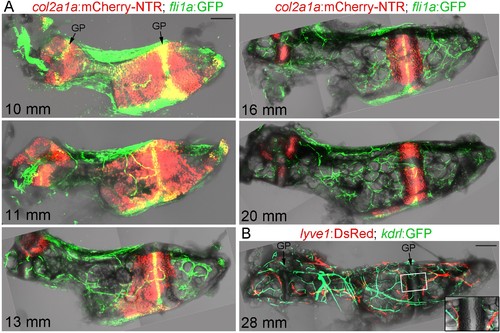
Vascularization of the Ch.(A) Confocal projections of dissected Ch bones at five successive stages. Merged fluorescent and brightfield channels show the gradual replacement of the cartilage with a fat-filled core. col2a1a:mCherry-NTR highlights chondrocytes that become increasingly restricted to two growth plates (GP) at either end of the bone. fli1a:GFP labels endothelial cells and chondrocytes located in the central portions of the growth plates. Vascularization of the Ch increases over time. n = 2 at each stage. (B) Confocal projection shows networks of kdrl:GFP+ vascular endothelial and lyve1:DsRed+ lymphatic endothelial cells within an adult Ch bone. The inset shows a single confocal section through the boxed portion of the growth plate, with both blood and lymphatic vessels abutting the edges but not penetrating into the growth plate. n = 2. Scale bars = 100 μm (A) and 200 μm (B). |
| Genes: | |
|---|---|
| Fish: | |
| Anatomical Terms: | |
| Stage Range: | Days 30-44 to Adult |