
Fig. 6
- ID
- ZDB-FIG-190628-28
- Publication
- Giovannone et al., 2019 - Programmed conversion of hypertrophic chondrocytes into osteoblasts and marrow adipocytes within zebrafish bones
- Other Figures
- All Figure Page
- Back to All Figure Page
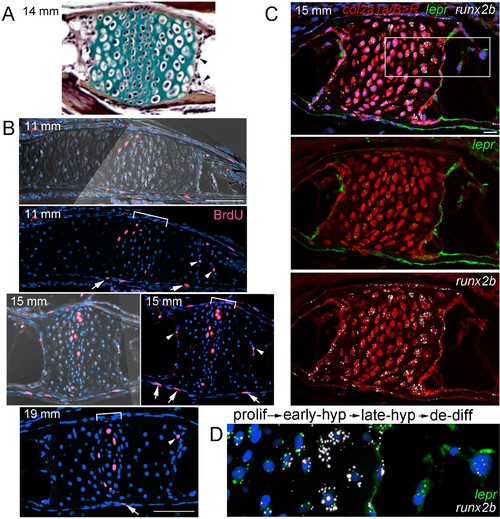
Late-stage hypertrophic chondrocytes re-enter the cell cycle and express lepr.(A) Pentachrome staining of a section through a Ch growth plate at 14 mm SL. Arrowheads denote two examples of hypertrophic chondrocytes at the edges of the growth plates that lack collagen-rich matrix (green) and appear to be exiting their lacunae. (B) BrdU incorporation (pink) relative to all nuclei (Hoechst, blue) shows recently divided cells. Fluorescent images with or without brightfield are shown for 11 and 15 mm SL stages, and fluorescent channel only for 19 mm SL. In addition to BrdU +cells in the proliferative zones of the growth plates (brackets) and perichondrium (arrows), a subset of hypertrophic chondrocytes at the edges of the growth plates (arrowheads) are BrdU+ at each stage. Proliferative hypertrophic chondrocytes were seen in sections from three independent animals at each stage. (C–D) Fluorescent RNAscope in situ hybridization for lepr (green) and the hypertrophic chondrocyte and osteoblast precursor marker runx2b (white). Red signal indicates cells derived from col2a1a/B > Rchondrocytes that were converted by addition of 4-OHT at five dpf (detected by anti-DsRed antibody), and all nuclei are shown in blue (Hoechst). In a section of a Ch growth plate at 15 mm SL, the merged channel above and red/green and red/white channels below show expression of lepr and runx2b in chondrocytes and their derivatives. In the higher magnification view of the boxed region (D), lepr is expressed in proliferative chondrocytes, runx2b is expressed at high levels and lepr at lower levels in early hypertrophic chondrocytes, and lepr and runx2b are co-expressed in late hypertrophic chondrocytes and adjacent mesenchymal cells that have been released from the growth plate. Similar expression of lepr and runx2b was seen in sections from 4/4 independent animals. Scale bars = 50 μm (B,C), 20 μm (D). |
| Genes: | |
|---|---|
| Fish: | |
| Condition: | |
| Anatomical Terms: | |
| Stage: | Days 45-89 |