
Fig. 1-S1
- ID
- ZDB-FIG-190628-20
- Publication
- Giovannone et al., 2019 - Programmed conversion of hypertrophic chondrocytes into osteoblasts and marrow adipocytes within zebrafish bones
- Other Figures
- All Figure Page
- Back to All Figure Page
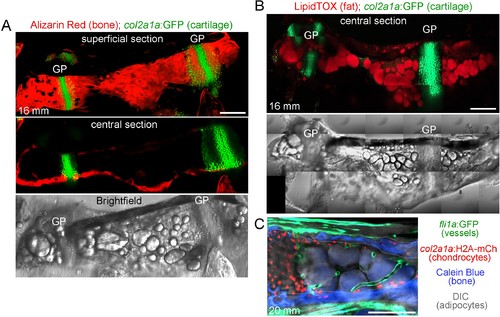
Ch bone and marrow fat structure.(A) Dissected Ch bone from a juvenile zebrafish (16 mm SL) shows staining of cartilage cells by col2a1a:GFP (green) and mineralized bone matrix by Alizarin Red. A superficial confocal section shows cortical bone along the length of the Ch, and a central section shows a lack of bone inside the Ch. Brightfield image of the same Ch shows large lipid droplets characteristic of marrow adipocytes. GP, growth plate. (B) Confocal projection of a dissected Ch (16 mm SL) from a col2a1a:GFP animal shows cartilage in green and adipocytes stained with LipidTOX in red. Brightfield image of the same Ch shows large lipid droplets overlapping with LipidTOX signal. n = 2. Scale bars = 100 μm. (C) Confocal section from a double transgenic animal (20 mm SL) shows fli1a:GFP+ blood vessels (green), col2a1a:H2A:mCherry-2A-GFPCAAX+ chondrocytes (red nuclei), Calcein Blue+ cortical bone (blue, outlined in white), and adipocytes (brightfield, grey). Note the cross-sectional and longitudinal slices through the blood vessels in the central portion of the marrow cavity (to the right of the chondrocytes and between the cortical bone). Scale bars = 100 μm (A,B), 50 μm (C). |