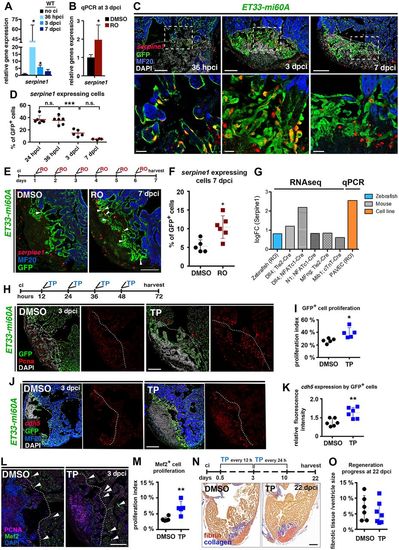
serpine1 is upregulated early upon cryoinjury and responds to Notch in endocardial/endothelial cells. (A) qPCR analysis of serpine1 in hearts with no cryoinjury (no ci) and at indicated time points following cryoinjury. Mean±s.d.; t-test, *P<0.05. (B) serpine1 qPCR in the injured heart. Mean±s.d.; t-test, *P<0.05. (C) serpine1 FISH plus IHC. At 36 hpci, numerous wound and wound-adjacent GFP+ endocardial cells express serpine1. At 3 and 7 dpci, serpine1-expressing wound endocardial cells are less frequent. Boxed areas are magnified beneath. (D) Scatter plot of the percentage of serpine1+ cells among all wound and wound-adjacent (50 μm) GFP+ cells. Mean±s.d.; one-way ANOVA and Newman-Keuls test, ***P<0.005 (see Table S5). (E) serpine1 FISH combined with IHC. RO-treated hearts (regime indicated at top) show more GPF+ cells expressing serpine1 (arrowheads). (F) Scatter plot indicating the percentage of serpine1+ endocardial cells. Mean±s.d.; t-test, *P<0.05. (G) Log fold change (FC) of serpine1 showing increased expression as assessed by qPCR in RO-treated PAVECs, by RNA-seq in RO-treated zebrafish hearts and in various murine models of endocardial Notch disruption. (H) IF indicating Pcna+ and GFP+ cells after TP treatment (regime indicated at top). (I) Scatter plot of the relative number of Pcna+ cells among all wound and wound-adjacent GFP+ cells. Mean±s.d.; t-test, *P<0.05. (J) FISH combined with IHC showing that TP treatment increases cdh5 mRNA levels in GFP+ wound endocardium. (K) Scatter plot of relative red fluorescence intensity, comparing values of remote and wound endocardium (see Fig. 2F). Mean±s.d.; t-test, **P<0.01. (L) IF revealed more Pcna+ Mef2+ wound-adjacent cardiomyocytes (arrowheads) after TP treatment. (M) Scatter plot of the relative number of Pcna+ cells among all wound-adjacent (100 µm) Mef2+ cardiomyocytes. Mean±s.d.; t-test, **P<0.01. (N) AFOG-stained hearts, treated with DMSO or TP (treatment regime indicated at top). (O) Scatter plot indicating injury site size (mean±s.d.). Dotted lines delineate injury site. Scale bars: 100 µm in C,E,H,J,L; 200 µm in N; 20 µm in magnified views.
|
