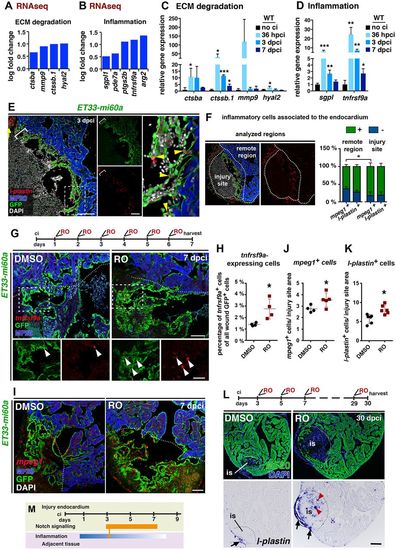
Notch signalling inhibition affects inflammatory gene expression and macrophage abundance. (A,B) RNA-seq analysis. Differential cardiac expression of genes related to ECM remodelling (A) and inflammation (B) in RO-treated fish at 3 dpci. (C,D) qPCR analysis of hearts with no cryoinjury (no ci) and at indicated time points following cryoinjury. Mean±s.d.; t-test, *P<0.05, **P<0.01, ***P<0.005. (E) FISH combined with IHC, showing l-plastin+ cells (arrowheads) in contact with GFP+ cells. l-plastin+ cell accumulations at the injury site locally coincide with high endocardial cell abundance (brackets). (F) The percentage of mpeg1-expressing or l-plastin-expressing inflammatory cells that contact (green) or do not contact (blue) endocardial cells at the injury site or remote region. Inflammatory cells at the outer epicardial region were not considered. (G) tnfrsf9a FISH combined with IHC. RO-treated hearts (regime indicated at top) show more GFP+ cells expressing tnfrsf9a. (H) Scatter plot showing percentage of tnfrsf9a+ endocardial cells. Mean±s.d.; t-test, *P<0.05. (I) mpeg1 FISH combined with IHC. RO treatment (regime in G) increased mpeg1+ macrophage abundance associated with the GFP+ endocardium. (J,K) Scatter plots of the number of mpeg1+ (J) or l-plastin+ (K) macrophages related to the area occupied by GFP+ cells. Only macrophages contacting GFP+ endocardial cells were considered. Mean±s.d.; t-test, *P<0.05. (L) MF20 IHC and l-plastin ISH on consecutive heart sections. RO treatment increased the numbers of l-plastin+ macrophages inside the MF20− injury site (red arrowheads). l-plastin+ macrophages in the outer region of the injury can be seen in both conditions (arrows). (M) Schematic showing time and intensity of the inflammatory response and Notch signalling activation at the injury site. Dotted lines delineate the injury site (is). Scale bars: 100 µm, except 50 µm in magnified views.
|
