
Fig. 2
- ID
- ZDB-FIG-170516-22
- Publication
- Münch et al., 2017 - Notch signalling restricts inflammation and serpine1 expression in the dynamic endocardium of the regenerating zebrafish heart.
- Other Figures
- All Figure Page
- Back to All Figure Page
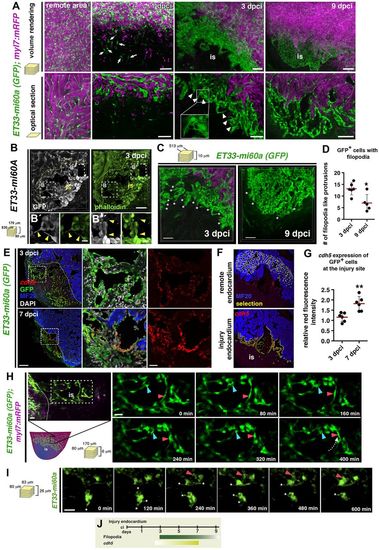
Characteristics of injury endocardium at different stages of regeneration. (A) Volume rendering and corresponding optical sections of part of the remote and injured region from ET33-mi60a;myl7:mRFP hearts. Remote region contains elongated and coherent GFP+ cells. At 1 dpci individual GFP+ cells are seen at the injury site (is) (arrows). At 3 dpci, dense, clustered endocardial cells with filopodia-like protrusions (arrowheads) are observed. At 9 dpci the endocardial cells are more organised, aligned and mostly lack filopodia-like protrusions. (B-B″) Vibratome section of ET33-mi60a heart stained for GFP and with phalloidin (for F-actin). Filopodia-like protrusions of wound endocardial cells show phalloidin staining (arrowheads). (C) Volume rendering of part of the injured region from ET33-mi60a;myl7:mRFP hearts. (D) Quantification of filopodia-like protrusions from comparable 3D images. Mean±s.d.; t-test, *P<0.05. (E) FISH combined with IF showing high cdh5 expression (red) in GFP+ wound endocardium. Boxed areas magnified on the right. (F,G) cdh5 (red) fluorescence intensity measurements with ImageJ software: GFP+ endocardium was selected (F, yellow) in the remote or wound region. Scatter plot (G) showing relative red fluorescence intensity comparing values of both regions. Mean±s.d.; t-test, **P<0.01. (H,I) Confocal still pictures from time-lapse movies (Movies 9, 10) of wound endocardial cells in cultured ET33-mi60a;myl7:mRFP hearts. The box in the schematic indicates the imaging region. Endocardial cells move (H,I, red arrowheads) and change their position (H, blue arrowhead). Dotted arrow (H) indicates the direction of cell migration. Endocardial cells present dynamic filopodia-like protrusions (I, asterisks). (J) Schematic showing wound endocardium characteristics. Filopodia-like protrusions are more abundant at early (3 dpci) than at later (9 dpci) phases. cdh5 expression increases when regeneration proceeds. Scale bars: 50 μm in A-C; 100 μm in E; 20 μm H,I; 10 μm in magnified views of B. |